
Published Year: 2021
Global AI in Healthcare Market: Analysis and Forecast, 2021-2030
The global AI in healthcare market is anticipated to reach $35,892.2 million by 2030,...
Focus on Component, End User, Application, and Operation - Analysis and Forecast, 2021-2031
Delivery Time: 1-5 Working Days
Get ISO Certified Research, Customization, Data Extraction, and Value-Added Services with All BIS Research Reports
BIS Research provides a comprehensive report library with unlimited access to data, insights, and market intelligence through Subscription.
Get Subscription Know More
1.1 Industry Outlook
1.1.1 Evolution of Wearable Robotic Exoskeletons
1.1.2 Impact of Emerging Technologies on Wearable Robotic Exoskeletons
1.1.2.1 Impact of Peripheral Technologies like IoT, AI, AR/VR.
1.1.2.2 Material Advancement in Exoskeletons
1.1.2.3 Design Modification in terms of Batteries, Weight Distribution, and UI
1.1.3 Regulatory Framework
1.1.4 Product Assortment and Pricing Analysis
1.1.5 Start-Up Scenario
1.1.6 Patent Analysis
1.1.7 Supply Chain Analysis
1.2 Market Dynamics
1.2.1 Business Drivers
1.2.1.1 Increasing Demand for Exoskeletons in Multiple Domains
1.2.1.2 Rising Investments by Major Industry Players and Establishment of Various Start-Ups
1.2.1.3 Demand to Increase Operational Efficiency of Individuals While Reducing Fatigue
1.2.2 Business Challenges
1.2.2.1 Limited Technological Capabilities Resulting in Inaccurate Operations
1.2.2.2 High Production Cost and Market Acceptance
1.2.3 Key Market Strategies and Developments
1.2.3.1 Long Term Collaborations, Mergers, Acquisition, Investments
1.2.3.2 Other Development
2.1 Global Wearable Robotic Exoskeletons Market (by End User)
2.1.1 Market Overview
2.1.2 Healthcare
2.1.2.1.1 Demand Analysis of Healthcare Exoskeleton Market
2.1.3 Industrial
2.1.3.1.1 Demand Analysis of Industrial Exoskeleton Market
2.1.4 Defense
2.1.4.1.1 Demand Analysis of Defense Exoskeletons Market
2.1.5 Commercial
2.1.5.1.1 Demand Analysis of Commercial Exoskeleton Market
2.2 Global Wearable Robotic Exoskeleton Market (by Sales Channel)
2.2.1 Overview
2.2.2 Subscription
2.2.2.1 Demand Analysis of Global Wearable Robotic Exoskeleton Market (Subscription)
2.2.3 Direct Purchase
2.2.3.1 Demand Analysis of Global Wearable Robotic Exoskeleton Market (Direct Purchase)
2.2.4 Resell and Upgrade
2.2.4.1 Demand Analysis of Global Wearable Robotic Exoskeleton Market (Resell and Upgrade)
3.1 Global Wearable Robotic Exoskeletons Market (by Operation)
3.1.1 Overview
3.1.2 Active Exoskeletons
3.1.2.1 Demand Analysis of Global Wearable Robotic Active Exoskeleton Market (by End User)
3.1.3 Passive Exoskeletons
3.1.3.1 Demand Analysis of Global Wearable Robotic Passive Exoskeleton Market (by End User)
3.2 Global Wearable Robotic Exoskeleton Market (by Type)
3.2.1 Overview
3.2.2 Fixed Exoskeletons
3.2.2.1 Demand Analysis of Global Wearable Robotic Fixed Exoskeleton Market
3.2.3 Mobile Exoskeletons
3.2.3.1 Demand Analysis of Global Wearable Robotic Mobile Exoskeleton Market
3.3 Global Wearable Robotic Exoskeleton Market (by Form)
3.3.1 Overview
3.3.2 Hard Exoskeletons
3.3.2.1 Demand Analysis of Global Wearable Robotic Hard Exoskeleton Market
3.3.3 Soft Exoskeletons
3.3.3.1 Demand Analysis of Global Wearable Robotic Soft Exoskeleton Market
3.4 Global Wearable Robotic Exoskeleton Market (by Limb)
3.4.1 Overview
3.5 Upper Limb Exoskeletons
3.5.1.1 Demand Analysis of Global Wearable Robotic Upper Limb Exoskeleton Market
3.5.2 Lower Limb Exoskeletons
3.5.2.1 Demand Analysis of Global Wearable Robotic Lower Limb Exoskeleton Market
3.5.3 Full Body Exoskeletons
3.5.3.1 Demand Analysis of Global Wearable Robotic Full Body Exoskeleton Market
3.6 Global Wearable Robotic Exoskeletons Market (by Actuation)
3.6.1 Overview
3.6.2 Electric Actuation
3.6.2.1 Demand Analysis of Global Wearable Robotic Exoskeleton Market (by Electric Actuation)
3.6.3 Hydraulic
3.6.3.1 Demand Analysis of Global Wearable Robotic Exoskeleton Market (by Hydraulic Actuation)
3.6.4 Mechanical
3.6.4.1 Demand Analysis of Global Wearable Robotic Exoskeleton Market (by Mechanical Actuation)
3.6.5 Others
3.6.5.1 Demand Analysis of Global Wearable Robotic Exoskeleton Market (by Other Actuation)
3.7 Global Wearable Robotic Exoskeleton Market (by Component)
3.7.1 Overview
3.7.2 Hardware
3.7.2.1 Demand Analysis of Global Wearable Robotic Exoskeleton Market (by Hardware)
3.7.3 Software
3.7.3.1 Demand Analysis of Global Wearable Robotic Exoskeleton Market (by Software)
4.1 Global Wearable Robotic Exoskeleton Market (by Region)
4.2 North America
4.2.1 Market
4.2.1.1 Key Manufacturers and Suppliers in North America
4.2.1.2 Business Drivers
4.2.1.3 Business Challenges
4.2.2 Application
4.2.2.1 North America Wearable Robotic Exoskeleton Market (by Application)
4.2.3 Product
4.2.3.1 North America Wearable Robotic Exoskeleton Market (by Operation)
4.2.4 North America (by Country)
4.2.4.1 U.S.
4.2.4.1.1 Market
4.2.4.1.1.1 Key Manufacturers in the U.S.
4.2.4.1.1.2 Business Challenges
4.2.4.1.1.3 Business Drivers
4.2.4.1.2 Application
4.2.4.1.2.1 U.S. Wearable Robotic Exoskeleton Market (by Application)
4.2.4.1.3 Product
4.2.4.1.3.1 U.S. Wearable Robotic Exoskeleton Market (by Operation)
4.2.4.2 Canada
4.2.4.2.1 Market
4.2.4.2.1.1 Business Challenges
4.2.4.2.1.2 Business Drivers
4.2.4.2.2 Application
4.2.4.2.2.1 Canada Wearable Robotic Exoskeleton Market (by Application)
4.2.4.2.3 Product
4.2.4.2.3.1 Canada Wearable Robotic Exoskeleton Market (by Operation)
4.3 Europe
4.3.1 Market
4.3.1.1 Key Manufacturers and Suppliers in Europe
4.3.1.2 Business Drivers
4.3.1.3 Business Challenges
4.3.2 Application
4.3.2.1 Europe Wearable Robotic Exoskeleton Market (by Application)
4.3.3 Product
4.3.3.1 Europe Wearable Robotic Exoskeleton Market (by Operation)
4.3.4 Europe (by Country)
4.3.4.1 France
4.3.4.1.1 Market
4.3.4.1.1.1 Business Challenges
4.3.4.1.1.2 Business Drivers
4.3.4.1.2 Application
4.3.4.1.2.1 France Wearable Robotic Exoskeleton Market (by Application)
4.3.4.1.3 Product
4.3.4.1.3.1 France Wearable Robotic Exoskeleton Market (by Operation)
4.3.4.2 Germany
4.3.4.2.1 Market
4.3.4.2.1.1 Business Challenges
4.3.4.2.1.2 Business Drivers
4.3.4.2.2 Application
4.3.4.2.2.1 Germany Wearable Robotic Exoskeleton Market (by Application)
4.3.4.2.3 Product
4.3.4.2.3.1 Germany Wearable Robotic Exoskeleton Market (by Operation)
4.3.4.3 Russia
4.3.4.3.1 Market
4.3.4.3.1.1 Business Challenges
4.3.4.3.1.2 Business Drivers
4.3.4.3.2 Application
4.3.4.3.2.1 Russia Wearable Robotic Exoskeleton Market (by Application)
4.3.4.3.3 Product
4.3.4.3.3.1 Russia Wearable Robotic Exoskeleton Market (by Operation)
4.3.4.4 U.K.
4.3.4.4.1 Market
4.3.4.4.1.1 Business Challenges
4.3.4.4.1.2 Business Drivers
4.3.4.4.2 Application
4.3.4.4.2.1 U.K. Wearable Robotic Exoskeleton Market (by Application)
4.3.4.4.3 Product
4.3.4.4.3.1 U.K. Wearable Robotic Exoskeleton Market (by Operation)
4.3.4.5 Rest-of-Europe
4.3.4.5.1 Market
4.3.4.5.1.1 Business Challenges
4.3.4.5.1.2 Business Drivers
4.3.4.5.2 Application
4.3.4.5.2.1 Rest-of-Europe Wearable Robotic Exoskeleton Market (by Application)
4.3.4.5.3 Product
4.3.4.5.3.1 Rest-of-Europe Wearable Robotic Exoskeleton Market (by Operation)
4.4 Asia-Pacific
4.4.1 Market
4.4.1.1 Key Manufacturers and Suppliers in Asia-Pacific
4.4.1.2 Business Drivers
4.4.1.3 Business Challenges
4.4.2 Application
4.4.2.1 Asia-Pacific Wearable Robotic Exoskeleton Market (by Application)
4.4.3 Product
4.4.3.1 Asia-Pacific Wearable Robotic Exoskeleton Market (by Operation)
4.4.4 Asia-Pacific (by Country)
4.4.4.1 China
4.4.4.1.1 Market
4.4.4.1.1.1 Business Challenges
4.4.4.1.1.2 Business Drivers
4.4.4.1.2 Application
4.4.4.1.2.1 China Wearable Robotic Exoskeleton Market (by Application)
4.4.4.1.3 Product
4.4.4.1.3.1 China Wearable Robotic Exoskeleton Market (by Operation)
4.4.4.2 India
4.4.4.2.1 Market
4.4.4.2.1.1 Business Challenges
4.4.4.2.1.2 Business Drivers
4.4.4.2.2 Application
4.4.4.2.2.1 India Wearable Robotic Exoskeleton Market (by Application)
4.4.4.2.3 Product
4.4.4.2.3.1 India Wearable Robotic Exoskeleton Market (by Operation)
4.4.4.3 Japan
4.4.4.3.1 Market
4.4.4.3.1.1 Business Challenges
4.4.4.3.1.2 Business Drivers
4.4.4.3.2 Application
4.4.4.3.2.1 Japan Wearable Robotic Exoskeleton Market (by Application)
4.4.4.3.3 Product
4.4.4.3.3.1 Japan Wearable Robotic Exoskeleton Market (by Operation)
4.4.4.4 Rest-of-Asia-Pacific
4.4.4.4.1 Market
4.4.4.4.1.1 Business Challenges
4.4.4.4.1.2 Business Drivers
4.4.4.4.2 Application
4.4.4.4.2.1 Rest-of-Asia-Pacific Wearable Robotic Exoskeleton Market (by Application)
4.4.4.4.3 Product
4.4.4.4.3.1 Rest-of-Asia-Pacific Wearable Robotic Exoskeleton Market (by Operation)
4.5 Rest-of-the-World
4.5.1 Market
4.5.1.1 Business Drivers
4.5.1.2 Business Challenges
4.5.2 Application
4.5.2.1 Rest-of-the-World Wearable Robotic Exoskeleton Market (by Application)
4.5.3 Product
4.5.3.1 Rest-of-the-World Wearable Robotic Exoskeleton Market (by Operation)
4.5.4 Rest-of-the-World (by Country)
4.5.4.1 Africa
4.5.4.1.1 Market
4.5.4.1.1.1 Business Challenges
4.5.4.1.1.2 Business Drivers
4.5.4.1.2 Application
4.5.4.1.2.1 Africa Wearable Robotic Exoskeleton Market (by Application)
4.5.4.1.3 Product
4.5.4.1.3.1 Africa Wearable Robotic Exoskeleton Market (by Operation)
4.5.4.2 Latin America
4.5.4.2.1 Market
4.5.4.2.1.1 Business Challenges
4.5.4.2.1.2 Business Drivers
4.5.4.2.2 Application
4.5.4.2.2.1 Latin America Wearable Robotic Exoskeleton Market (by Application)
4.5.4.2.3 Product
4.5.4.2.3.1 Latin America Wearable Robotic Exoskeleton Market (by Operation)
4.5.4.3 Middle East
4.5.4.3.1 Market
4.5.4.3.1.1 Business Challenges
4.5.4.3.1.2 Business Drivers
4.5.4.3.2 Application
4.5.4.3.2.1 Middle East Wearable Robotic Exoskeleton Market (by Application)
4.5.4.3.3 Product
4.5.4.3.3.1 Middle East Wearable Robotic Exoskeleton Market (by Operation)
5.1 Competitive Benchmarking
5.2 ATOUN Inc.
5.2.1 Company Overview
5.2.2 Product Portfolio
5.2.3 Strategic Overview
5.2.4 SWOT Analysis of ATOUN Inc.
5.3 B-Temia Inc.
5.3.1 Company Overview
5.3.2 Product Portfolio
5.3.3 Strategic Overview
5.3.4 SWOT Analysis of B-Temia Inc.
5.4 Bionik Laboratories Corporation
5.4.1 Company Overview
5.4.2 Product Portfolio
5.4.3 Strategic Overview
5.4.4 SWOT Analysis of Bionik Laboratories
5.4.5 Financial Overview
5.4.6 R&D Analysis
5.5 Cyberdyne Inc.
5.5.1 Company Overview
5.5.2 Product Portfolio
5.5.3 Strategic Overview
5.5.4 SWOT Analysis of CYBERDYNE Inc
5.5.5 Financial Overview
5.5.6 R&D Analysis
5.6 Daiya Industry Co., Ltd.
5.6.1 Company Overview
5.6.2 Product Portfolio
5.6.3 Business Strategies
5.6.4 SWOT Analysis of Daiya Industry Co
5.7 Ekso Bionics
5.7.1 Company Overview
5.7.2 Product Portfolio
5.7.3 Strategic Overview
5.7.4 SWOT Analysis of Ekso Bionics
5.7.5 Financial Overview
5.7.6 R&D Analysis
5.8 Focal Meditech BV
5.8.1 Company Overview
5.8.2 Product Portfolio
5.8.3 Business Strategies
5.8.4 SWOT Analysis of Focal Meditech BV
5.9 Hocoma AG
5.9.1 Company Overview
5.9.2 Product Portfolio
5.9.3 Business Strategies
5.9.4 SWOT Analysis of Hocoma AG.
5.10 Hyundai Motor Company
5.10.1 Company Overview
5.10.2 Product Portfolio
5.10.3 Strategic Overview
5.10.4 SWOT Analysis of Hyundai Motor Company
5.10.5 R&D Analysis
5.11 Honda Motor Co., Ltd.
5.11.1 Company Overview
5.11.2 Product Portfolio
5.11.3 Strategic Overview
5.11.4 SWOT Analysis of Honda Motor Co., Ltd
5.11.5 Financial Overview
5.11.6 R&D Analysis
5.12 Lockheed Martin
5.12.1 Company Overview
5.12.2 Product Portfolio
5.12.3 Strategic Overview
5.12.4 SWOT Analysis of Lockheed Martin
5.12.5 R&D Analysis
5.13 Mitsubishi Heavy Industries Ltd.
5.13.1 Company Overview
5.13.2 Product Portfolio
5.13.3 Strategic Overview
5.13.4 SWOT Analysis of Mitsubishi Heavy Industries Ltd.
5.13.5 R&D Analysis
5.14 Myomo Inc.
5.14.1 Company Overview
5.14.2 Product Portfolio
5.14.3 Strategic Overview
5.14.4 SWOT Analysis of Myomo Inc.
5.14.5 R&D Analysis
5.15 P&S Mechanics Co. Ltd.
5.15.1 Company Overview
5.15.2 Product Portfolio
5.15.3 Strategic Overview
5.15.4 SWOT Analysis of P&S Mechanics Co. Ltd.
5.16 Parker Hannifin Corporation
5.16.1 Company Overview
5.16.2 Product Portfolio
5.16.3 Strategic Overview
5.16.4 SWOT Analysis of Parker Hannifin Corporation
5.16.5 R&D Analysis
5.17 ReWalk Robotics Ltd.
5.17.1 Company Overview
5.17.2 Product Portfolio
5.17.3 Strategic Overview
5.17.4 SWOT Analysis of ReWalks Robotics
5.17.5 R&D Analysis
5.18 Rex Bionics PLC
5.18.1 Company Overview
5.18.2 Product Portfolio
5.18.3 Strategic Overview
5.18.4 SWOT Analysis of Rex Bionics Ltd.
5.19 Other Key Players
Research Methodology
Table 1: Product Offerings by Leading Exoskeleton Manufacturers
Table 2: Features and User Characteristics of Top Powered Exoskeletons
Table 3: Selling Price of Top Exoskeletons
Table 4: Top Funded Startups
Table 5: Patent Analysis: Energy Storage Device for an Exoskeleton
Table 6: Patent Analysis: Exoskeleton Sub-Assembly and Exoskeleton Structure Including such a Sub-Assembly
Table 7: Patent Analysis: Interface System in an Exoskeleton
Table 8: Patent Analysis: Lower-Body Exoskeleton Using Electromyography for Direct Force Amplification
Table 9: Patent Analysis: Bio-Inspired Standing Balance Controller for a Full-Mobilization Exoskeleton
Table 10: Patent Analysis: Exoskeleton Device with Improved Actuation System
Table 11: Patent Analysis: Padded and Prewired Exoskeleton Harness
Table 12: Patent Analysis: Load Transfer Belt Adapted to Carry At Least One Accessory of a Passive Exoskeleton
Table 13: Patent Analysis: Exoskeleton Boot and Lower Link
Table 14: Major Rehabilitation Exoskeletons
Table 15: Major Military Exoskeletons
Table 16: Long Term Collaborations, Mergers, Acquisitions, and Investments
Table 17: Other Development
Table 18: Wearable Robotic Exoskeleton Market (by Healthcare), $Million, 2020-2031
Table 19: Wearable Robotic Exoskeleton Market (by Healthcare), Units, 2020-2031
Table 20: Wearable Robotic Exoskeleton Market (by Industrial), $Million, 2020-2031
Table 21: Wearable Robotic Exoskeleton Market (by Industrial), Units, 2020-2031
Table 22: Wearable Robotic Exoskeleton Market (by Defense), $Million, 2020-2031
Table 23: Wearable Robotic Exoskeleton Market (by Defense), Units, 2020-2031
Table 24: Wearable Robotic Exoskeleton Market (by Commercial), $Million, 2020-2031
Table 25: Wearable Robotic Exoskeleton Market (by Commercial), Units, 2020-2031
Table 26: Wearable Robotic Exoskeleton Market (by Sales Channel), $Million, 2020-2031
Table 27: Wearable Robotic Exoskeleton Market (by Sales Channel), Units, 2020-2031
Table 28: Wearable Robotic Exoskeleton Market (by Operation), $Million, 2020-2031
Table 29: Wearable Robotic Exoskeleton Market (by Operation), Units, 2020-2031
Table 30: Wearable Robotic Exoskeleton Market (by Type), $Million, 2020-2031
Table 31: Wearable Robotic Exoskeleton Market (by Type), Units, 2020-2031
Table 32: Wearable Robotic Exoskeleton Market (by Form), $Million, 2020-2031
Table 33: Wearable Robotic Exoskeleton Market (by Form), Units, 2020-2031
Table 34: Global Wearable Robotic Hard Exoskeleton Market, Units, 2020-2031, Units, 2020-2031
Table 35: Wearable Robotic Exoskeleton Market (by Limb), $Million, 2020-2031
Table 36: Wearable Robotic Exoskeleton Market (by Limb), Units, 2020-2031
Table 37: Wearable Robotic Exoskeleton Market (by Actuation), $Million, 2020-2031
Table 38: Wearable Robotic Exoskeleton Market (by Actuation), Units, 2020-2031
Table 39: Wearable Robotic Exoskeleton Market (by Component), $Million, 2020-2031
Table 40: Wearable Robotic Exoskeleton Market (by Component), Units, 2020-2031
Table 41: Global Wearable Robotic Exoskeleton Market (by Region), $Million, 2020-2031
Table 42: Global Wearable Robotic Exoskeleton Market (by Region), Units, 2020-2031
Table 43: North America Wearable Robotic Exoskeleton Market (by Application), $Million, 2020-2031
Table 44: North America Wearable Robotic Exoskeleton Market (by Application), Units, 2020-2031
Table 45: North America Wearable Robotic Exoskeleton Market (by Operation), $Million, 2020-2031
Table 46: North America Wearable Robotic Exoskeleton Market (by Operation), Units, 2020-2031
Table 47: U.S. Wearable Robotic Exoskeleton Market (by Application), $Million, 2020-2031
Table 48: U.S. Wearable Robotic Exoskeleton Market (by Application), Units, 2020-2031
Table 49: U.S. Wearable Robotic Exoskeleton Market (by Operation), $Million, 2020-2031
Table 50: U.S. Wearable Robotic Exoskeleton Market (by Operation), Units, 2020-2031
Table 51: Canada Wearable Robotic Exoskeleton Market (by Application), $Million, 2020-2031
Table 52: Canada Wearable Robotic Exoskeleton Market (by Application), Units, 2020-2031
Table 53: Canada Wearable Robotic Exoskeleton Market (by Operation), $Million, 2020-2031
Table 54: Canada Wearable Robotic Exoskeleton Market (by Operation), Units, 2020-2031
Table 55: Europe Wearable Robotic Exoskeleton Market (by Application), $Million, 2020-2031
Table 56: Europe Wearable Robotic Exoskeleton Market (by Application), Units, 2020-2031
Table 57: Europe Wearable Robotic Exoskeleton Market (by Operation), $Million, 2020-2031
Table 58: Europe Wearable Robotic Exoskeleton Market (by Operation), Units, 2020-2031
Table 59: France Wearable Robotic Exoskeleton Market (by Application), $Million, 2020-2031
Table 60: France Wearable Robotic Exoskeleton Market (by Application), Units, 2020-2031
Table 61: France Wearable Robotic Exoskeleton Market (by Operation), $Million, 2020-2031
Table 62: France Wearable Robotic Exoskeleton Market (by Operation), Units, 2020-2031
Table 63: Germany Wearable Robotic Exoskeleton Market (by Application), $Million, 2020-2031
Table 64: Germany Wearable Robotic Exoskeleton Market (by Application), Units, 2020-2031
Table 65: Germany Wearable Robotic Exoskeleton Market (by Operation), $Million, 2020-2031
Table 66: Germany Wearable Robotic Exoskeleton Market (by Operation), Units, 2020-2031
Table 67: Russia Wearable Robotic Exoskeleton Market (by Application), $Million, 2020-2031
Table 68: Russia Wearable Robotic Exoskeleton Market (by Application), Units, 2020-2031
Table 69: Russia Wearable Robotic Exoskeleton Market (by Operation), $Million, 2020-2031
Table 70: Russia Wearable Robotic Exoskeleton Market (by Operation), Units, 2020-2031
Table 71: U.K. Wearable Robotic Exoskeleton Market (by Application), $Million, 2020-2031
Table 72: U.K. Wearable Robotic Exoskeleton Market (by Application), Units, 2020-2031
Table 73: U.K. Wearable Robotic Exoskeleton Market (by Operation), $Million, 2020-2031
Table 74: U.K. Wearable Robotic Exoskeleton Market (by Operation), Units, 2020-2031
Table 75: Rest-of-Europe Wearable Robotic Exoskeleton Market (by Application), $Million, 2020-2031
Table 76: Rest-of-Europe Wearable Robotic Exoskeleton Market (by Application), Units, 2020-2031
Table 77: Rest-of-Europe Wearable Robotic Exoskeleton Market (by Operation), $Million, 2020-2031
Table 78: Rest-of-Europe Wearable Robotic Exoskeleton Market (by Operation), Units, 2020-2031
Table 79: Asia-Pacific Wearable Robotic Exoskeleton Market (by Application), $Million, 2020-2031
Table 80: Asia-Pacific Wearable Robotic Exoskeleton Market (by Application), Units, 2020-2031
Table 81: Asia-Pacific Wearable Robotic Exoskeleton Market (by Operation), $Million, 2020-2031
Table 82: Asia-Pacific Wearable Robotic Exoskeleton Market (by Operation), Units, 2020-2031
Table 83: China Wearable Robotic Exoskeleton Market (by Application), $Million, 2020-2031
Table 84: China Wearable Robotic Exoskeleton Market (by Application), Units, 2020-2031
Table 85: China Wearable Robotic Exoskeleton Market (by Operation), $Million, 2020-2031
Table 86: China Wearable Robotic Exoskeleton Market (by Operation), Units, 2020-2031
Table 87: India Wearable Robotic Exoskeleton Market (by Application), $Million, 2020-2031
Table 88: India Wearable Robotic Exoskeleton Market (by Application), Units, 2020-2031
Table 89: India Wearable Robotic Exoskeleton Market (by Operation), $Million, 2020-2031
Table 90: India Wearable Robotic Exoskeleton Market (by Operation), Units, 2020-2031
Table 91: Japan Wearable Robotic Exoskeleton Market (by Application), $Million, 2020-2031
Table 92: Japan Wearable Robotic Exoskeleton Market (by Application), Units, 2020-2031
Table 93: India Wearable Robotic Exoskeleton Market (by Operation), $Million, 2020-2031
Table 94: Japan Wearable Robotic Exoskeleton Market (by Operation), Units, 2020-2031
Table 95: Rest-of-Asia-Pacific Wearable Robotic Exoskeleton Market (by Application), $Million, 2020-2031
Table 96: Rest-of-Asia-Pacific Wearable Robotic Exoskeleton Market (by Application), Units, 2020-2031
Table 97: Rest-of-Asia-Pacific Wearable Robotic Exoskeleton Market (by Operation), $Million, 2020-2031
Table 98: Rest-of-Asia-Pacific Wearable Robotic Exoskeleton Market (by Operation), Units, 2020-2031
Table 99: Rest-of-the-World Wearable Robotic Exoskeleton Market (by Application), $Million, 2020-2031
Table 100: Rest-of-the-World Wearable Robotic Exoskeleton Market (by Application), Units, 2020-2031
Table 101: Rest-of-Asia-Pacific Wearable Robotic Exoskeleton Market (by Operation), $Million, 2020-2031
Table 102: Rest-of-the-World Wearable Robotic Exoskeleton Market (by Operation), Units, 2020-2031
Table 103: Rest-of-the-World Wearable Robotic Exoskeleton Market (by Application), $Million, 2020-2031
Table 104: Africa Wearable Robotic Exoskeleton Market (by Application), Units, 2020-2031
Table 105: Rest of Asia Pacific Wearable Robotic Exoskeleton Market (by Operation), $Million, 2020-2031
Table 106: Africa Wearable Robotic Exoskeleton Market (by Operation), Units, 2020-2031
Table 107: Latin America Wearable Robotic Exoskeleton Market (by Application), $Million, 2020-2031
Table 108: Latin America Wearable Robotic Exoskeleton Market (by Application), Units, 2020-2031
Table 109: Latin America Wearable Robotic Exoskeleton Market (by Operation), $Million, 2020-2031
Table 110: Latin America Wearable Robotic Exoskeleton Market (by Operation), Units, 2020-2031
Table 111: Middle East Wearable Robotic Exoskeleton Market (by Application), $Million, 2020-2031
Table 112: Middle East Wearable Robotic Exoskeleton Market (by Application), Units, 2020-2031
Table 113: Middle East Wearable Robotic Exoskeleton Market (by Operation), $Million, 2020-2031
Table 114: Middle East Wearable Robotic Exoskeleton Market (by Operation), Units, 2020-2031
Table 115: Table: Benchmarking and Weightage Parameters
Table 116: Table: wearable robotic exoskeleton Players, Benchmarking Score
Table 117: ATOUN Inc.: Product Portfolio
Table 118: B-Temia Inc.: Product Portfolio
Table 119: Bionik Laboratories Corporation: Product Portfolio
Table 120: Cyberdyne Inc: Product Portfolio
Table 121: Product Portfolio
Table 122: Ekso Bionics: Product Portfolio
Table 123: Focal Meditech BV: Product Portfolio
Table 124: Hocoma AG.: Product Portfolio
Table 125: Hyundai Motor Company: Product Portfolio
Table 126: Honda Motor Co., Ltd.: Product Portfolio
Table 127: Lockheed Martin: Product Portfolio
Table 128: Contract
Table 129: Mitsubishi Heavy Industries Ltd.: Product Portfolio
Table 130: Myomo Inc.: Product Portfolio
Table 131: P&S Mechanics Co. Ltd.: Product Portfolio
Table 132: Parker Hannifin Corporation: Product Portfolio
Table 133: ReWalks Robotics: Product Portfolio
Table 134: Rex Bionics Ltd.: Product Portfolio
List of Figures
Figure 1: Global Installation of Industrial Robots, Thousand Units, 2015-2019
Figure 2: Global Wearable Robotic Exoskeleton Market, $Million, 2020-2031
Figure 3: Global Wearable Robotic Exoskeleton Market (by End User), $Million, 2021 and 2031
Figure 4: Global Wearable Robotic Exoskeleton Market (by End User), Units, 2021 and 2031
Figure 5: Global Wearable Robotic Exoskeleton Market (by Application), $Million, 2021 and 2031
Figure 6: Global Wearable Robotic Exoskeleton Market (by Application), Units, 2021 and 2031
Figure 7: Global Wearable Robotic Exoskeleton Market (by Sales Channel), $Million, 2020-2031
Figure 8: Global Wearable Robotic Exoskeleton Market (by Sales Channel), Units, 2020-2031
Figure 9: Global Wearable Robotic Exoskeleton Market (by Region), $Million, 2031
Figure 10: Wearable Robotic Exoskeleton Market Coverage
Figure 11: Major Technological Advancements in Wearable Robotic Exoskeleton
Figure 12: Regulatory Bodies Involved in the Global Wearable Robotic Exoskeleton Market
Figure 13: Wearable Robotic Exoskeleton: Supply Chain Analysis
Figure 14: Focus Areas for Designing Wearable Robotic Exoskeleton
Figure 15: Manufacturing Cost Scenario for Powered Robotic Exoskeletons
Figure 16: Spinal Cord Facts and Figures
Figure 17: Wearable Robotic Exoskeleton Market (by End User)
Figure 18: Classification of End User Exoskeleton (by Healthcare)
Figure 19: Classification of End User Exoskeleton (by Industrial)
Figure 20: Classification of End User Exoskeleton (by Defense)
Figure 21: Classification of End User Exoskeleton (by Commercial)
Figure 22: Global Wearable Robotic Exoskeleton Market (Subscription), $Million, 2020-2031
Figure 23: Global Wearable Robotic Exoskeleton Market (Subscription), Units, 2020-2031
Figure 24: Global Wearable Robotic Exoskeleton Market (Direct Purchase), $Million, 2020-2031
Figure 25: Global Wearable Robotic Exoskeleton Market (Direct Purchase), Units, 2020-2031
Figure 26: Global Wearable Robotic Exoskeleton Market (Resell and Upgrade), $Million, 2020-2031
Figure 27: Global Wearable Robotic Exoskeleton Market (Resell and Upgrade), Units, 2020-2031
Figure 28: Classification of Active Exoskeletons (by End User)
Figure 29: Global Wearable Robotic Active Exoskeleton Market (by End User), $Million, 2020-2031
Figure 30: Global Wearable Robotic Active Exoskeleton Market (by End User), Units, 2020-2031
Figure 31: Classification of Passive Exoskeletons (by End User)
Figure 32: Global Wearable Robotic Passive Exoskeleton Market (by End User), $Million, 2020-2031
Figure 33: Global Wearable Robotic Passive Exoskeleton Market (by End User), Units, 2020-2031
Figure 34: Classification of Global Wearable Robotic Exoskeletons (by Type)
Figure 35: Global Wearable Robotic Fixed Exoskeleton Market, $Million, 2020-2031
Figure 36: Global Wearable Robotic Fixed Exoskeleton Market, Units, 2020-2031
Figure 37: Global Wearable Robotic Mobile Exoskeleton Market, $Million, 2020-2031
Figure 38: Global Wearable Robotic Mobile Exoskeleton Market, Units, 2020-2031
Figure 39: Classification of Global Wearable Robotic Exoskeleton (by Form)
Figure 40: Global Wearable Robotic Hard Exoskeleton Market, Units, 2020-2031, $Million, 2020-2031
Figure 41: Global Wearable Robotic Soft Exoskeleton Market, $Million, 2020-2031
Figure 42: Global Wearable Robotic soft Exoskeleton Market, Units, 2020-2031
Figure 43: Classification of Global Wearable Robotic Exoskeleton (by Limb)
Figure 44: Global Wearable Robotic Upper Limb Exoskeleton Market, $Million, 2020-2031
Figure 45: Global Wearable Robotic Upper Limb Exoskeleton Market, Units, 2020-2031
Figure 46: Global Wearable Robotic Lower Limb Exoskeleton Market, $Million, 2020-2031
Figure 47: Global Wearable Robotic Lower Limb Exoskeleton Market, Units, 2020-2031
Figure 48: Global Wearable Robotic Full Body Exoskeleton Market, $Million, 2020-2031
Figure 49: Global Wearable Robotic Full Body Exoskeleton Market, Units, 2020-2031
Figure 50: Classification of Global Wearable Robotic Exoskeleton (by Actuation)
Figure 51: Global Wearable Robotic Exoskeletons Market (by Electric Actuation), $Million, 2020-2031
Figure 52: Global Wearable Robotic Exoskeleton Market (by Electric Actuation), Units, 2020-2031
Figure 53: Global Wearable Robotic Exoskeleton Market Hydraulic Actuation), $Million, 2020-2031
Figure 54: Global Wearable Robotic Exoskeleton Market (by Hydraulic Actuation), Units, 2020-2031
Figure 55: Global Wearable Robotic Exoskeleton Market (by Mechanical Actuation), $Million, 2020-2031
Figure 56: Global Wearable Robotic Exoskeleton Market (by Mechanical Actuation), Units, 2020-2031
Figure 57: Global Wearable Robotic Exoskeleton Market (by Other Actuation), $Million, 2020-2031
Figure 58: Global Wearable Robotic Exoskeleton Market (by Other Actuation), Units, 2020-2031
Figure 59: Classification of Exoskeletons Hardware (by Component)
Figure 60: Global Wearable Robotic Exoskeleton Market (by Hardware), $Million, 2020-2031
Figure 61: Global Wearable Robotic Exoskeleton Market (by Hardware), Units, 2020-2031
Figure 62: Global Wearable Robotic Exoskeleton Market (by Software), $Million, 2020-2031
Figure 63: Global Wearable Robotic Exoskeleton Market (by Software), Units, 2020-2031
Figure 64: Wearable Robotic Exoskeleton Market: Competitive Benchmarking
Figure 65: Bionik Laboratories Corporation: Financial Overview, 2018-2020
Figure 66: Bionik Laboratories (R&D Expenditure), $Million, 2018-2020
Figure 67: CYBERDYNE Inc: Financial Overview, 2018-2020
Figure 68: CYBERDYNE Inc. (R&D Expenditure), $Million, 2018-2020
Figure 69: Ekso Bionics: Financial Overview, 2018-2020
Figure 70: Ekso Bionics: Segment Split, 2018-2020
Figure 71: Ekso Bionics: Regional Split, 2018-2020
Figure 72: Ekso Bionics (R&D Expenditure), $Million, 2018-2020
Figure 73: Hyundai Motor Company (R&D Expenditure), $Billion, 2018-2020
Figure 74: Honda Motor Co., Ltd.: Financial Overview, 2018-2020
Figure 75: Honda Motor Co., Ltd.: Segment Split, 2018-2020
Figure 76: Honda Motor Co., Ltd.: Regional Split, 2018-2020
Figure 77: Honda Motor Co. (R&D Expenditure), $Billion, 2018-2020
Figure 78: Lockheed Martin (R&D Expenditure), $Billion, 2018-2020
Figure 79: Mitsubishi Heavy Industries (R&D Expenditure), $Billion, 2018-2020
Figure 80: Myomo Inc. (R&D Expenditure), $Million, 2018-2020
Figure 81: Parker Hannifin Corporation (R&D Expenditure), 2018-2020
Figure 82: ReWalk Robotics (R&D Expenditure), $Million, 2018-2020
Figure 83: Research Methodology
Figure 84: Top-Down and Bottom-Up Approach
Figure 85: Global Wearable Robotic Exoskeleton Market Influencing Factors
Figure 86: Assumptions and Limitations
Scope of the Global Wearable Robotic Exoskeleton Market
The global wearable robotic exoskeleton market research provides the market information for segmentations, such as end user based on application and components in terms of hardware and software. The market analysis examines the global wearable robotic exoskeleton market outlook in terms of the trends, driving forces, opportunities, technological advancements, and competitive benchmarking, among others.
The report further takes into consideration the market and business dynamics, along with the detailed product contribution of the key players operating in the market.
Global Wearable Robotic Exoskeleton Market Segmentation
The report constitutes an extensive study of the wearable robotics industry. The report largely focuses on providing market information for the wearable robotic exoskeletons covering various segments, namely, end user, application, sales model, component, type, form, and region. The end user segment is classified as healthcare, industrial, defense and commercial, operations include active exoskeleton and passive exoskeleton, position include fixed and mobile exoskeleton. A brief description of soft exoskeletons and hard exoskeletons along with their market potential, is also explained in the report.
The global wearable robotic exoskeleton market is segregated by region under four major regions, namely, North America, Europe, APAC, and Rest-of-the-World. Data for each of these regions (by country) has been provided in the report.
Key Companies in the Global Wearable Robotic Exoskeleton Market
The key players in the global wearable robotic exoskeleton market include ATOUN Inc., B-Temia Inc., Bionik Laboratories Corporation, Cyberdyne Inc., Daiya Industry Co., Ltd., Ekso Bionics Holdings, Inc., Focal Meditech BV, Hocoma AG, Hyundai Motor, Honda Motor Co., Ltd., Lockheed Martin Corporation, Mitsubishi Heavy Industries Ltd., Myomo Inc., P&S Mechanics Co. Ltd., Parker Hannifin Corporation, ReWalk Robotics Ltd., and Rex Bionics PLC.
• What are the futuristic trends in this market, and how is the market expected to change over the forecast years 2021-2031?
• What are the key drivers and challenges faced by the companies that are currently operating in the wearable robotic exoskeleton market?
• How is the market expected to grow during the forecast period 2021-2031?
• What are the opportunities for the companies to expand their businesses in the wearable robotic exoskeleton market?
• Which region is expected to lead the wearable robotic exoskeleton market by 2031?
• What are the key developmental strategies implemented by the key players to sustain in this highly competitive market?
• What is the current and future revenue scenario of this market?
Global Wearable Robotic Exoskeleton Market Forecast, 2021-2031
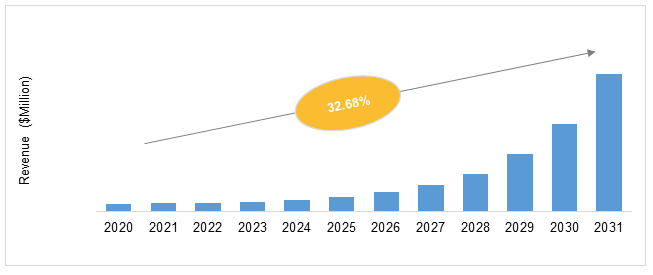
The global wearable robotic exoskeleton industry analysis by BIS Research projects the market to have a significant growth rate of 32.68% based on the value and a growth rate of 34.01% based on volume during the forecast period 2021-2031. The North America region is expected to dominate the market by 2031 with a share of 38.20%. The North America region includes the U.S. and Canada, where the U.S. is expected to acquire a major share in 2031 due to the increase in the investment by the exoskeleton manufacturing companies in the country.
The wearable robotic exoskeleton market has gained huge importance in the past few years. This is due to the rising geriatric population across the globe and increasing awareness about exoskeletons among the end users. Several government agencies, non-profit organizations, and associations have started investing in the market, thereby generating a lucrative market for new players.
Focus on Component, End User, Application, and Operation - Analysis and Forecast, 2021-2031
The global wearable robotic exoskeleton market is projected to have a significant growth rate of 32.68% based on the market value during the forecast years 2021-2031.
The increasing demand for exoskeletons in multiple domains, rising investments by major industry players and establishment of various start-ups, and demand to increase operational efficiency of individuals while reducing fatigue, are some of the prime business drivers affecting the growth of this emerging technology.
Factors such as limited technological capabilities resulting in inaccurate operations and high production cost and market acceptance, pose a challenge to the growth of wearable robotic exoskeleton market.
During the period 2021-2031, the North American region is expected to occupy a major market share of 38.20% in the global wearable robotic exoskeleton market due to the increase in the investment by the exoskeleton manufacturing companies.
The key players in the global wearable robotic exoskeleton market include Cyberdyne Inc., Hocoma AG, Lockheed Martin Corporation, Myomo Inc., Rex Bionics PLC, Bionik Laboratories Corporation, Ekso Bionics Holdings Inc., and Hyundai Motor, among others.
The global AI in healthcare market is anticipated to reach $35,892.2 million by 2030,...

The global super soldier wearable technology market is expected to witness substantial growth...

The collaborative robot industry analysis by BIS Research projects the market to grow at a...
1. Please contact us to discuss customization options, and we can confirm the time and cost (if any). For minor customization requirements that would take 3-5 days, we do not charge any additional amount.
2. All BIS Research reports are delivered to clients via our InsightMonk platform. This allows the customers to extract the data in Excel for their use. Excel is provided for all License types and is not limited to just enterprise users.
3. Additionally, all customers also get access to the following complimentary value-added services from BIS Research.
*Expert Consultation Charges applicable