A quick peek into the report
Table of Contents
1.1 Inclusion and Exclusion
2.1 Scope of Work
2.2 Key Questions Answered in the Report
3.1 Global RNA Sequencing Market: Research Methodology
3.2 Data Sources
3.3 Secondary Data Sources
3.4 Market Estimation Model
3.5 Criteria for Company Profiling
4.1 Current State of RNA Sequencing
4.2 Market Footprint and Future Potential
4.2.1 North America
4.2.1.1 Future Potential
4.2.2 Europe
4.2.2.1 Future Potential
4.2.3 Asia-Pacific
4.2.3.1 Future Potential
4.2.4 Latin America
4.2.4.1 Future Potential
4.2.5 Rest-of-the-World
4.2.5.1 Future Potential
4.3 Technology Assessment
4.4 Commercialized Platforms and Applications
5.1 Legal and Regulatory Framework
5.1.1 U.S.
5.1.1.1 Guidelines Published in FY2018
5.1.1.2 Guidelines Published in FY2016
5.1.2 Europe
5.1.3 Japan
5.2 Patent Landscape
5.3 Comparison of RNA Sequencing Costs
5.4 Publication Statistics
6.1 Overview
6.2 Impact Analysis of Market Dynamics
6.3 Market Drivers
6.3.1 Increase in Adoption of Personalized Medicine due to Decrease in Cost of Sequencing
6.3.2 Increased Utility in Predictive Biomarkers and Therapeutic Response Research
6.3.3 Significant External Funding for Executing Research and Development
6.4 Market Restraints
6.4.1 Expected Implementation of Patient Protection and Affordable Care Act in the U.S
6.4.2 Existing Lawsuits
6.4.3 High Capital Requirement Hampering the Expansion of Global Reach
6.5 Market Opportunities
6.5.1 Development of Portable and Cost-Efficient Technologies
6.5.2 Hybridization of Technologies
7.1 Key Strategies and Developments
7.1.1 Product Launch and Upgradations
7.1.2 Synergistic Activities
7.1.3 Funding and Expansions
7.1.4 Mergers and Acquisitions
7.1.5 Product Approvals
7.2 Market Share Analysis
7.3 Growth Share Analysis (by Companies), 2018
8.1 Overview
8.2 Instruments
8.2.1 Fully Automated Systems
8.2.2 Semi-Automated Instruments
8.3 Reagents and Kits
8.3.1 Sample Enrichment
8.3.2 Sample Isolation and Extraction
8.3.3 Library Preparation
8.3.4 Sequencing
8.4 Software
9.1 Overview
9.2 Single Molecule Based Sequencing
9.3 Sequence by Synthesis Technology
9.4 Nanopore Sequencing Technology
9.5 Ion Torrent Semiconductor Sequencing
10.1 Overview
10.2 Sample Isolation and Extraction
10.2.1 Market Size and Future Potential
10.3 Sample Enrichment
10.3.1 Market Size and Future Potential
10.4 Library Preparation
10.4.1 Market Size and Future Potential
10.5 Sequencing
10.5.1 Market Size and Future Potential
10.6 Data Analysis and Management
10.6.1 Market Size and Future Potential
11.1 Overview
11.2 Biopharmaceuticals
11.3 Diagnostic Centers
11.4 Life-sciences and Biotechnology Companies
11.5 Research and Academia
12.1 Overview
12.2 Diagnostics
12.2.1 Market Size and Future Potential
12.3 Drug Discovery
12.3.1 Market Size and Future Potential
12.4 Translational Medicine
12.4.1 Market Size and Future Potential
12.5 Others
13.1 Overview
13.2 North America
13.2.1 Key Dynamics
13.2.2 Competitive Landscape
13.2.3 U.S.
13.2.3.1 Market Size and Growth Potential
13.2.3.2 New Market Opportunities
13.2.3.3 Unmet Needs
13.2.4 Canada
13.2.4.1 Market Size and Growth Potential
13.2.4.2 New Market Opportunities
13.2.4.3 Unmet Needs
13.3 Europe
13.3.1 Key Dynamics
13.3.2 Competitive Landscape
13.3.3 Germany
13.3.3.1 Market Size and Growth Potential
13.3.3.2 New Market Opportunities
13.3.3.3 Unmet Needs
13.3.4 U.K.
13.3.4.1 Market Size and Growth Potential
13.3.4.2 New Market Opportunities
13.3.4.3 Unmet Needs
13.3.5 France
13.3.5.1 Market Size and Growth Potential
13.3.5.2 New Market Opportunities
13.3.5.3 Unmet Needs
13.3.6 Italy
13.3.6.1 Market Size and Growth Potential
13.3.6.2 New Market Opportunities
13.3.6.3 Unmet Needs
13.3.7 Spain
13.3.7.1 Market Size and Growth Potential
13.3.7.2 New Market Opportunities
13.3.7.3 Unmet Needs
13.3.8 Russia
13.3.8.1 Market Size and Growth Potential
13.3.9 Rest-of-Europe
13.4 Asia-Pacific
13.4.1 Key Dynamics
13.4.2 Competitive Landscape
13.4.3 China
13.4.3.1 Market Size and Growth Potential
13.4.3.2 New Market Opportunities
13.4.3.3 Unmet Needs
13.4.4 Japan
13.4.4.1 Market Size and Growth Potential
13.4.4.2 New Market Opportunities
13.4.4.3 Unmet Needs
13.4.5 India
13.4.5.1 Market Size and Growth Potential
13.4.5.2 New Market Opportunities
13.4.5.3 Unmet Needs
13.4.6 Australia
13.4.6.1 Market Size and Growth Potential
13.4.6.2 New Market Opportunities
13.4.6.3 Unmet Needs
13.4.7 South Korea
13.4.7.1 Market Size and Growth Potential
13.4.7.2 New Market Opportunities
13.4.7.3 Unmet Needs
13.4.8 Rest-of-APAC
13.5 Latin America
13.5.1 Key Dynamics
13.5.2 Brazil
13.5.2.1 Market Size and Growth Potential
13.5.2.2 New Market Opportunities
13.5.2.3 Unmet Needs
13.5.3 Mexico
13.5.3.1 Market Size and Growth Potential
13.5.3.2 New Market Opportunities
13.5.3.3 Unmet Needs
13.5.4 Rest-of-Latin America
13.6 Rest-of-the-World
13.6.1 Key Dynamics
13.6.1.1 New Market Opportunities
13.6.1.2 Unmet Needs
14.1 Overview
14.2 Agilent Technologies, Inc.
14.2.1 Company Overview
14.2.2 Role of Agilent Technologies, Inc. in the Global RNA Sequencing Market
14.2.3 Financials
14.2.4 Key Insights About Financial Health of the Company
14.2.5 SWOT Analysis
14.3 Bio-Rad Laboratories, Inc.
14.3.1 Company Overview
14.3.2 Role of Bio-Rad Laboratories, Inc. in the Global RNA Sequencing Market
14.3.3 Financials
14.3.4 Key Insights About Financial Health of the Company
14.3.5 SWOT Analysis
14.4 BGI
14.4.1 Company Overview
14.4.2 Role of BGI in the Global RNA Sequencing Market
14.4.3 Financials
14.4.4 Key Insights About Financial Health of the Company
14.4.5 SWOT Analysis
14.5 F. Hoffmann-La Roche AG
14.5.1 Company Overview
14.5.2 Role of F. Hoffmann-La Roche AG in the Global RNA Sequencing Market
14.5.3 Financials
14.5.4 Key Insights About Financial Health of the Company
14.5.5 SWOT Analysis
14.6 Fluidigm Corporation
14.6.1 Company Overview
14.6.2 Role of Fluidigm Corporation in the Global RNA Sequencing Market
14.6.3 Financials
14.6.4 Key Insights About Financial Health of the Company
14.6.5 SWOT Analysis
14.7 Illumina, Inc.
14.7.1 Company Overview
14.7.2 Role of Illumina, Inc. in the Global RNA Sequencing Market
14.7.3 Financials
14.7.4 Key Insights About Financial Health of the Company
14.7.5 SWOT Analysis
14.8 Lexogen GmbH
14.8.1 Company Overview
14.8.2 Role of Lexogen GmbH in the Global RNA Sequencing Market
14.8.3 SWOT Analysis
14.9 Oxford Nanopore Technologies
14.9.1 Company Overview
14.9.2 Role of Oxford Nanopore Technologies in the Global RNA Sequencing Market
14.9.3 SWOT Analysis
14.10 Pacific Biosciences
14.10.1 Company Overview
14.10.2 Role of Pacific Biosciences in the Global RNA Sequencing Market
14.10.3 Financials
14.10.4 Key Insights About Financial Health of the Company
14.10.5 SWOT Analysis
14.11 Dolomite Bio
14.11.1 Company Overview
14.11.2 Role of Dolomite Bio. in the Global RNA Sequencing Market
14.11.3 SWOT Analysis
14.12 Merck KGaA
14.12.1 Company Overview
14.12.2 Role of Merck KGaA in the Global RNA Sequencing Market
14.12.3 Financials
14.12.4 Key Insights About Financial Health of the Company
14.12.5 SWOT Analysis
14.13 Becton, Dickinson and Company
14.13.1 Company Overview
14.13.2 Role of Becton, Dickinson and Company in the Global RNA Sequencing Market
14.13.3 Financials
14.13.4 Key Insights About Financial Health of the Company
14.13.5 SWOT Analysis
14.14 Takara Bio Inc.
14.14.1 Company Overview
14.14.2 Role of Takara Bio Inc. in the Global RNA Sequencing Market
14.14.3 Financials
14.14.4 Key Insights About Financial Health of the Company
14.14.5 SWOT Analysis
14.15 QIAGEN N.V.
14.15.1 Company Overview
14.15.2 Role of QIAGEN N.V. plc in the Global RNA Sequencing Market
14.15.3 Financials
14.15.4 Key Insights About Financial Health of the Company
14.15.5 SWOT Analysis
14.16 Thermo Fisher Scientific Inc.
14.16.1 Company Overview
14.16.2 Role of Thermo Fisher Scientific in the Global RNA Sequencing Market
14.16.3 Financials
14.16.4 Key Insights About Financial Health of the Company
14.16.5 SWOT Analysis
Table 4.1: Assessment of Existing Technologies in Global RNA Sequencing Market
Table 4.2: Key Commercialized Products Offered by Major Market Players
Table 5.1: Performance and Cost Comparison of Sequencing Platforms of Various Generations
Table 6.1: Cost comparison Analysis of Portable Sequencers
Table 8.1: Specifications of Available Instruments in the Market
Table 8.2: Respective Offerings of Key Players in Kits Segment
Table 8.3: Key Products (Kits and Reagents) Currently Offered by Key Market Players
Figure 1: Implications of RNA Sequencing
Figure 2: Cumulative Number of Genes Linked to Rare Diseases, 2010-2018
Figure 3: Impact Analysis of Market Drivers and Market Challenges on the Global RNA Sequencing Market
Figure 4: Global RNA Sequencing Market, by Product Type, 2018 vs. 2028 ($Million)
Figure 5: Global RNA Sequencing Market, by Technology, 2018 vs. 2028 ($Million)
Figure 6: Global RNA Sequencing Market, by Workflow, 2018 vs. 2028 ($Million)
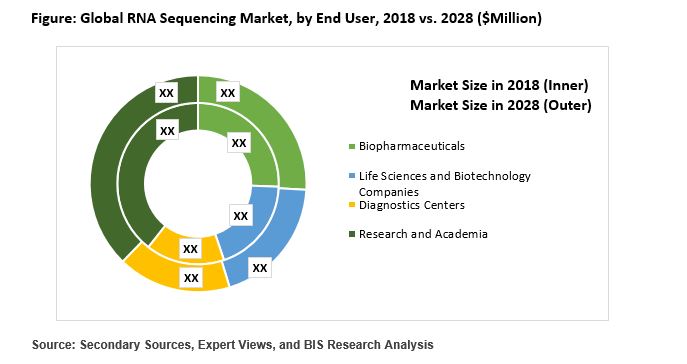
Figure 7: Global RNA Sequencing Market, by End User, 2018 vs. 2028 ($Million)
Figure 8: Global RNA Sequencing Market, by Application, 2018 vs. 2028 ($Million)
Figure 9: Global RNA Sequencing Market Snapshot
Figure 2.1: Global RNA Sequencing Market Segmentation
Figure 3.1: Global RNA Sequencing Market Research Methodology
Figure 3.2: Bottom-Up Approach (Segment-Wise Analysis)
Figure 3.3: Top-Down Approach (Segment-Wise Analysis)
Figure 4.1: North America RNA Sequencing Market, 2018-2028
Figure 4.2: North America RNA Sequencing Market – Key Driving Factors & Impact
Figure 4.3: Europe RNA Sequencing Market, 2018-2028
Figure 4.4: Europe RNA Sequencing Market – Key Driving Factors & Impact
Figure 4.5: Asia-Pacific RNA Sequencing Market, 2018-2028
Figure 4.6: Asia-Pacific RNA Sequencing Market – Key Driving Factors & Impact
Figure 4.7: Latin America RNA Sequencing Market, 2018-2028
Figure 4.8: Latin America RNA Sequencing Market – Key Driving Factors & Impact
Figure 4.9: Rest-of-the-World RNA Sequencing Market, 2018-2028
Figure 4.10: Rest-of-the-World RNA Sequencing Market – Key Driving Factors & Impact
Figure 5.1: Global RNA Sequencing Market: Existing Patent Segmentation
Figure 5.2: NGS RNA Sequencing Publications (2009-2017)
Figure 6.1: Impact Analysis of Market Drivers and Restraints
Figure 6.2: Cost of Genome Sequencing 2010-2018
Figure 6.3: Global RNA Sequencing Market: Funding Scenario (FY2016-FY2019)
Figure 7.1: Key Developments and Strategies, 2016–2019
Figure 7.2: Product Launch and Upgradations (by Company), 2016–2019
Figure 7.3: Synergistic Activities (by Company), 2016 –2019
Figure 7.4: Funding and Expansions (by Company), 2016 –2019
Figure 7.5: Mergers and Acquisitions Share (by Company), 2016 –2019
Figure 7.6: Product Approvals Share (by Company), 2016 –2019
Figure 7.7: Market Share Analysis for the Global RNA Sequencing Market, 2018
Figure 7.8: Growth Share Matrix for Global RNA Sequencing Market (by Companies), 2018
Figure 8.1: Global RNA Sequencing Market (by Product Type)
Figure 8.2: Global RNA Sequencing Market (by Product Type), 2019 and 2028
Figure 8.3: Global RNA Sequencing Market for Instruments, 2018-2028
Figure 8.4: Global RNA Sequencing Market for Fully Automated Instruments, 2018-2028
Figure 8.5: Global RNA Sequencing Market for Semi-Automated Instruments, 2018-2028
Figure 8.6: Global RNA Sequencing Market for Reagents and Kits, 2018-2028
Figure 8.7: Global Sample Enrichment Reagent and Kits Market, 2018-2028
Figure 8.8: Global Sample Isolation, Extraction Reagent and Kits Market, 2018-2028
Figure 8.9: Global Library Preparation Reagent and Kits Market, 2018-2028
Figure 8.10: Global Sequencing Reagent and Kits Market, 2018-2028
Figure 8.11: Global RNA Sequencing Market for Software, 2018-2028
Figure 9.1: Global RNA Sequencing Market (by Technology), 2018-2028
Figure 9.2: Global RNA Sequencing Market for Single Molecule Based Sequencing Technology Segment, 2018-2028
Figure 9.3: Global RNA Sequencing Market for Sequence by Synthesis Technology Segment, 2018-2028
Figure 9.4: Global RNA Sequencing Market for Nanopore Sequencing Technology Segment, 2018-2028
Figure 9.5: Global RNA Sequencing Market for Ion Torrent Semiconductor Sequencing Technology Segment, 2018-2028
Figure 10.1: Global RNA Sequencing Market (by Workflow), 2019 and 2028
Figure 10.2: Global RNA Sequencing Market for Sample Isolation and Extraction, 2018-2028
Figure 10.3: Global RNA Sequencing Market for Sample Enrichment, 2018-2028
Figure 10.4: Global RNA Sequencing Market for Library Preparation, 2018-2028
Figure 10.5: Global RNA Sequencing Market for Sequencing, 2018-2028
Figure 10.6: Global RNA Sequencing Market for Data Analysis and Management, 2018-2028
Figure 11.1: Global RNA Sequencing Market (by End User)
Figure 11.2: Global RNA Sequencing Market (by End User), 2019 and 2028
Figure 11.3: Global RNA Sequencing Market for Biopharmaceuticals, 2018-2028
Figure 11.4: Global RNA Sequencing Market for Diagnostic Centers, 2018-2028
Figure 11.5: Global RNA Sequencing Market for Life-Sciences and Biotechnology Companies, 2018-2028
Figure 11.6: Global RNA Sequencing Market for Research and Academia, 2018-2028
Figure 12.1: Global RNA Sequencing Market (by Application), 2019 and 2028
Figure 12.2: Global RNA Sequencing Market for Diagnostics, 2018-2028
Figure 12.3: Global RNA Sequencing Market for Drug Discovery, 2018-2028
Figure 12.4: Global RNA Sequencing Market for Translational Medicine, 2018-2028
Figure 12.5: Global RNA Sequencing Market for Other Applications Market, 2018-2028
Figure 13.1: RNA Sequencing Market (by Region), 2019 and 2028
Figure 13.2: RNA Sequencing Market (by Region), 2018-2028
Figure 13.3: North America: Market Dynamics
Figure 13.4: North America RNA Sequencing Market, (by Country), 2018-2028
Figure 13.5: North America: Growth Strategies by Key Market Players, (2016-2019)
Figure 13.6: North America: Competitive Assessment of Key Market Players
Figure 13.7: U.S. RNA Sequencing Market), 2018-2028
Figure 13.8: Canada RNA Sequencing Market, 2018-2028
Figure 13.9: Europe: Market Dynamics
Figure 13.10: Europe RNA Sequencing Market, (by Country), 2018-2028
Figure 13.11: Europe: Growth Strategies by Key Market Players, (2016-2019)
Figure 13.12: Europe: Competitive Assessment of Key Market Players
Figure 13.13: Germany RNA Sequencing Market, 2018-2028
Figure 13.14: U.K. RNA Sequencing Market, 2018-2028
Figure 13.15: France RNA Sequencing Market, 2018-2028
Figure 13.16: Italy RNA Sequencing Market, 2018-2028
Figure 13.17: Spain RNA Sequencing Market, 2018-2028
Figure 13.18: Russia RNA Sequencing Market, 2018-2028
Figure 13.19: Rest-of-Europe RNA Sequencing Market, 2018-2028
Figure 13.20: Asia-Pacific: Market Dynamics
Figure 13.21: Asia-Pacific RNA Sequencing Market, (by Country), 2018-2028
Figure 13.22: Asia-Pacific: Growth Strategies by Key Market Players, (2016-2019)
Figure 13.23: Asia-Pacific: Competitive Assessment of Key Market Players
Figure 13.24: China RNA Sequencing Market, 2018-2028
Figure 13.25: Japan RNA Sequencing Market, 2018-2028
Figure 13.26: India RNA Sequencing Market, 2018-2028
Figure 13.27: Australia RNA Sequencing Market, 2018-2028
Figure 13.28: South Korea RNA Sequencing Market, 2018-2028
Figure 13.29: Rest-of-APAC RNA Sequencing Market, 2018-2028
Figure 13.30: Latin America: Market Dynamics
Figure 13.31: Latin America RNA Sequencing Market, (by Country), 2018-2028
Figure 13.32: Brazil RNA Sequencing Market, 2018-2028
Figure 13.33: Mexico RNA Sequencing Market, 2018-2028
Figure 13.34: Rest-of-Latin America RNA Sequencing Market, 2018-2028
Figure 13.35: Rest-of-the-World: Market Dynamics
Figure 13.36: Rest-of-the-World RNA Sequencing Market, 2018-2028
Figure 14.1: Total Number of Companies Profiled
Figure 14.2: Agilent Technologies, Inc.: Overall Product Portfolio
Figure 14.3: Agilent Technologies, Inc.: Overall Financials, 2017-2019
Figure 14.4: Agilent Technologies, Inc.: Revenue (by Segment), 2017-2019
Figure 14.5: Agilent Technologies, Inc.: Revenue (by Region), 2017-2019
Figure 14.6: Agilent Technologies, Inc.: R&D Expenditure, 2017-2019
Figure 14.7: Agilent Technologies, Inc.: SWOT Analysis
Figure 14.8: Bio-Rad Laboratories, Inc.: Overall Product Portfolio
Figure 14.9: Bio-Rad Laboratories, Inc.: Overall Financials, 2016-2018
Figure 14.10: Bio-Rad Laboratories, Inc.: Sales (by Segment), $Million, 2016-2018
Figure 14.11: Bio-Rad Laboratories, Inc.: Sales (by Region), 2016-2018
Figure 14.12: Bio-Rad Laboratories, Inc.: R&D Expenditure, 2016-2018
Figure 14.13: Bio-Rad Laboratories, Inc.: SWOT Analysis
Figure 14.14: BGI: Overall Product Portfolio
Figure 14.15: BGI: Overall Financials, 2017-2018
Figure 14.16: BGI: Sales (by Segment), 2017-2018
Figure 14.17: BGI: Sales (by Region), 2017-2018
Figure 14.18: BGI: R&D Expenditure, 2017-2018
Figure 14.19: BGI: SWOT Analysis
Figure 14.20: F. Hoffmann-La Roche AG: Overall Product Portfolio
Figure 14.21: F. Hoffmann-La Roche AG: Overall Financials, 2016-2018
Figure 14.22: F. Hoffmann-La Roche AG: Revenue (by Segment), $Million, 2016-2018
Figure 14.23: F. Hoffmann-La Roche AG: Revenue (by Region), 2016-2018
Figure 14.24: F. Hoffmann-La Roche AG: R&D Expenditure, 2016-2018
Figure 14.25: F. Hoffmann-La Roche AG: SWOT Analysis
Figure 14.26: Fluidigm Corporation: Overall Product Portfolio
Figure 14.27: Fluidigm Corporation: Overall Financials, 2016-2018
Figure 14.28: Fluidigm Corporation: Revenue (by Business Segment), 2016-2018
Figure 14.29: Fluidigm Corporation: Revenue (by Region), 2016-2018
Figure 14.30: Fluidigm Corporation: R&D Expenditure, 2016-2018
Figure 14.31: Fluidigm Corporation: SWOT Analysis
Figure 14.32: Illumina, Inc.: Overall Product Portfolio
Figure 14.33: Illumina, Inc.: Overall Financials, 2016-2018
Figure 14.34: Illumina, Inc.: Revenue (by Segment), $Million, 2016-2018
Figure 14.35: Illumina, Inc.: Revenue (by Region), 2016-2018
Figure 14.36: Illumina, Inc.: R&D Expenditure, 2016-2018
Figure 14.37: Illumina, Inc.: SWOT Analysis
Figure 14.38: Lexogen GmbH: Overall Product Portfolio
Figure 14.39: Lexogen GmbH: SWOT Analysis
Figure 14.40: Oxford Nanopore Technologies: Product Offerings
Figure 14.41: Oxford Nanopore Technologies: SWOT Analysis
Figure 14.42: Pacific Biosciences: Existing Product Offerings in Global RNA Sequencing Market
Figure 14.43: Pacific Biosciences: Overall Financials, 2016-2018
Figure 14.44: Pacific Biosciences: Revenue (by Region), 2016-2018
Figure 14.45: Pacific Biosciences: R&D Expenditure, 2016-2018
Figure 14.46: Pacific Biosciences: SWOT Analysis
Figure 14.47: Dolomite Bio.: Existing Product Offerings in Global RNA Sequencing Market
Figure 14.48: Dolomite Bio.: SWOT Analysis
Figure 14.49: Merck KGaA: Existing Product Offerings in the Global RNA Sequencing Market
Figure 14.50: Merck KGaA: Overall Financials, 2016-2018
Figure 14.51: Merck KGaA: Revenue (by Segment), $Million, 2016-2018
Figure 14.52: Merck KGaA: Revenue (by Region), 2016-2018
Figure 14.53: Merck KGaA: R&D Expenditure, 2016-2018
Figure 14.54: Merck KGaA: SWOT Analysis
Figure 14.55: Beckton, Dickinson and Company: Existing Product Offerings in Global RNA Sequencing Market
Figure 14.56: Becton, Dickinson and Company: Overall Financials, 2017-2019
Figure 14.57: Becton, Dickinson and Company: Revenue (by Business Segment), 2017-2019
Figure 14.58: Becton, Dickinson and Company: Revenue Split for BD Life Sciences, 2017-2019
Figure 14.59: Becton, Dickinson and Company: Revenue (by Region), 2017-2019
Figure 14.60: Becton, Dickinson and Company: R&D Expenditure, 2017-2019
Figure 14.61: Becton, Dickinson and Company: SWOT Analysis
Figure 14.62: Takara Bio Inc.: Existing Product Offerings in Global RNA Sequencing Market
Figure 14.63: Takara Bio Inc.: Overall Financials, 2017-2019
Figure 14.64: Takara Bio Inc.: Revenue (by Segment), 2017-2019
Figure 14.65: Takara Bio Inc.: Revenue (by Region), 2017-2019
Figure 14.66: Takara Bio Inc.: R&D Expenditure, 2017-2019
Figure 14.67: Takara Bio Inc.: SWOT Analysis
Figure 14.68: QIAGEN N.V.: Existing Product Offerings in Global RNA Sequencing Market
Figure 14.69: QIAGEN N.V.: Overall Financials, 2016-2018
Figure 14.70: QIAGEN N.V.: Revenue (by Segment), $Million, 2016-2018
Figure 14.71: QIAGEN N.V.: Revenue (by Region), 2016-2018
Figure 14.72: QIAGEN N.V.: R&D Expenditure, 2016-2018
Figure 14.73: QIAGEN N.V.: SWOT Analysis
Figure 14.74: Thermo Fisher Scientific Inc.: Existing Product Offerings in Global RNA Sequencing Market
Figure 14.75: Thermo Fisher Scientific Inc.: Overall Financials, 2016-2018
Figure 14.76: Thermo Fisher Scientific Inc: Sales (by Segment), $Billion, 2016-2018
Figure 14.77: Thermo Fisher Scientific Inc.: Sales (by Region), 2016-2018
Figure 14.78: Thermo Fisher Scientific Inc.: R&D Expenditure, 2016-2018
Figure 14.79: Thermo Fisher Scientific Inc.: SWOT Analysis
Market Overview
Market Overview - Global RNA Sequencing Market
RNA sequencing, a genomic approach used for the identification and quantification analysis of RNA molecules. The ultimate aim is to study the cellular responses from a biological sample. The advent of RNA sequencing had fueled several innovations in the medical sector, by facilitating other techniques (that utilizes RNA sequencing) such as single nucleotide polymorphisms identification, RNA editing, transcriptional profiling and differential gene expression analysis.
According to the European Organization for Rare Diseases (EURORDIS), currently, there are about 5,000 to 7,000 existing rare diseases such as cystic fibrosis, hemophilia, and muscular dystrophy, among others, affecting 6-8% of the European population. In the European Union (EU), approximately 75% of the rare diseases affect children, amongst which, about 80% of the rare diseases are based on genetics, thereby increasing clinical burden.
RNA sequencing offers massive diagnostic utility in terms of rare diseases, which ranges from rare muscular disorders to mitochondrial diseases such as mitochondrial depletion syndrome, Leigh’s syndrome, and Kearns-Sayre syndrome, among others. RNA sequencing is an emerging technique to assess different rare diseases progression.
It aids medical professionals to understand various genes linked with specific rare diseases, thereby offering specific treatment for patients. The rise in the discovery of genes associated with rare diseases coupled with the declining cost of genome sequencing is anticipated to enhance research in the rare disease segment. This is likely to support sequencing, particularly RNA sequencing, in the upcoming years.
As per BIS research analysis, the RNA sequencing market is projected to reach $3,521.0 million by 2028 from $976.1 million in 2018, at a CAGR of 14.21%. Growth in the market is anticipated to be driven by an enhanced utility in patient stratification and therapeutic research and significant external funding for executing research and development to fill in the current diagnostic and treatment gaps.
However, there are potential restraining factors hindering the growth of the market. These factors include a severe lack of approvals from the government regulatory authorities coupled with uncertain regulatory and reimbursement policies, and requirement of high capital, among others.
Growth Drivers |
• Increase in Adoption of Personalized Medicine due to Decrease in Cost of Sequencing • Increased Utility in Predictive Biomarkers and Therapeutic Response Research • Significant External Funding for Executing Research and Development |
||
Market Challenges |
• Expected Implementation of Patient Protection and Affordable Care Act in the U.S • Existing Lawsuits • High Capital Requirement Hampering the Expansion of Global Reach |
||
Market Opportunities |
• Development of Portable and Cost-Efficient Technologies • Hybridization of Technologies |
Growth Factors
- Increase in Adoption of Personalized Medicine due to Decrease in Cost of Sequencing: With the introduction of next-generation sequencing (NGS) technologies, capable of offering huge amount of data with faster turnaround time, the cost of genome sequencing has drastically gone down over the past few years. The reduction in the cost of genome sequencing has led to the widespread adoption of personalized approach in the emerging economies, thus positively impacting the adoption of RNA sequencing product lines. In addition to this, significant funding had been offered for technological advancements, including RNA sequencing, by the government organizations of various countries which are mentioned below.
- Increased Utility in Predictive Biomarkers and Therapeutic Response Research: The advent of RNA sequencing for the profiling and discovery of RNA based drug response predictive biomarkers had improvised overall therapeutic outcomes pertaining to cancers. The fact, that RNA sequencing facilitates the identification of differentially expressed genes, had enabled several researchers to efficiently identify up and down regulated genes that are associated with different cancers.
- Significant External Funding for Executing Research and Development: Owing to the significant funding triggered by several government/non-governmental organizations and venture capitals to life sciences and biotechnology companies that are actively engaged in the development of RNA sequencing product lines, the scope in the growth of overall RNA sequencing market is relatively high.
Key Questions Answered in this Report:
• What are the major market drivers, restraining factors, and opportunities in the global RNA sequencing market?
• What are the underlying structures resulting in the emerging trends within the global RNA sequencing market?
• What are the key development strategies which are incorporated by the major players in order to sustain in the competitive market?
• What are the key regulatory implications in developed and developing regions for RNA sequencing?
• What are the key patents obtained by the companies for various technologies in the global RNA sequencing market?
• How each segment of the market is anticipated to grow during the forecast period 2019 to 2028 and what is the estimated revenue to be generated by each of the segments on the basis of:
o product type, including types of instruments, reagents and kits, and software
o technology, including, single-molecule-based sequencing, sequence by synthesis technology, nanopore sequencing technology, and ion torrent sequencing technology
o workflow, including sample enrichment, nucleic acid isolation and extraction, library preparation, sequencing, and data analysis and management
o end user, including biopharmaceuticals, life science and biotechnology companies, diagnostic centers, and research and academia
o applications, including drug discovery, translational medicine, diagnostics, and others
o region, including North America, Europe, Asia-Pacific, Latin America, and Rest-of-the-World
• Who are the leading players with significant offering to the global RNA sequencing market? What is the anticipated market dominance for each of these leading players?
• Which companies are anticipated to be highly disruptive in the future and why?
• What are the challenges in the global RNA sequencing market currently?
Report Description
Market Report Coverage - Global RNA Sequencing Market |
|||
Base Year |
2018 |
Market Size by 2018 |
$976.1 Million |
Forecast Period |
2019-2028 |
Value Estimation by 2028 |
$ 3,521.0 Million |
CAGR During Forecast Period |
14.21% |
Number of Tables |
|
Market Segmentation |
• Product Type – Instruments, Reagents and Kits, and Software • Technology - Single Molecule Based Sequencing, Sequence by Synthesis Technology, Nanopore Sequencing Technology, and Ion Torrent Semiconductor Sequencing • Workflow - Sample Isolation and Extraction, Sample Enrichment, Library Preparation, Sequencing, and Data Analysis and Management • End-User – Biopharmaceuticals, Diagnostic Centers, Life-sciences and Biotechnology Companies, and Research and Academia • Applications – Diagnostics, Drug Discovery, Translational Medicine, and Others |
||
Regional Segmentation |
• North America – Canada and U.S. • Europe - U.K., Germany, France, Italy, Spain, Russia, and Rest-of-Europe • Asia-Pacific – China, India, and South Korea, Japan, Australia, and Rest-of-Asia-Pacific • Latin America - Brazil, Mexico, and Rest-of-Latin America |
||
Key Companies Profiled |
The key manufacturers who have been contributing significantly to the RNA sequencing market are Agilent Technologies, Inc., Bio-Rad Laboratories, Inc., BGI, F. Hoffmann La-Roche AG, Fluidigm Corporation, Illumina, Inc., Lexogen GmbH, Oxford Nanopore Technologies, Pacific Biosciences, QIAGEN N.V., Thermo Fisher Scientific Inc., Becton, Dickinson and Company, Dolomite Bio, Takara Bio Inc., and Merck KGaA., among others. |
Market Segmentation
Market Outlook by Product Type
The product type segment of the market is sub-segmented into instruments, reagents and kits, and software. Based on the overall market share, the reagents and kits segment emerged as a prominent segment by contributing a significant market share in 2018. The sub-segment is expected to continue this dominance by 2028. The large share can be attributed to the requirement of kits and consumables in every step of RNA sequencing according to the requirement. With the rising research in the field of genomics, including RNA sequencing, this segment is expected to grow significantly, simultaneously bolstering the overall market.
By Technology
The technology segment is categorized into single molecule based sequencing, sequence by synthesis technology, nanopore sequencing technology, and ion torrent semiconductor sequencing. Based on the overall market share, the sequence by synthesis technology segment emerged as a prominent segment and attributed for a significant market share in 2018. It is expected to maintain the market share dominance in the technology segment by 2028. The large share of this segment is attributed to the existing advantages of this technology which is capable to generate high yields per sample with maximum read length.
By Workflow
The workflow segment is further categorized into sample isolation and extraction, sample enrichment, library preparation, sequencing, and data analysis and management. Based on the market share, the library preparation segment emerges as a prominent segment in 2018, closely followed by the sequencing segment. By 2028, as well the library preparation segment is expected to maintain market share dominance followed by sequencing. The large share of the segment is attributed to increasing growth of automated sequencers consisting of unique features such as flexible scalability, portability, and real-time data streaming.
By End User
The end user segment is sub-segmented into biopharmaceuticals, diagnostic centers, life-sciences and biotechnology companies, and research and academia. In context of market share, the research and academia segment emerged as a prominent segment in 2018. The large share of this segment is attributed to the increase in research activities pertaining to RNA sequencing for developing new technologies to meet the growing demand.
Global RNA Sequencing Market
Focus on Product, Technology, Workflow, End User, Application, Region, and Competitive Landscape - Analysis and Forecast, 2019-2028