Published Year: 2017
Global Small Satellites Market - Analysis and Forecast - 2017 to 2021: Focus on Types (Femto, Pico,
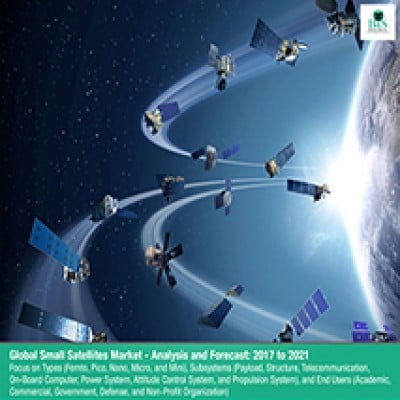
The small satellites market reported a revenue of $2,528.1 million in 2016, and the government...
Focus on Sizes (1U, 2U, 3U, 6U, and Other Sizes),Subsystems, and End Users (Academic, Commercial, Government, Defense,and Non-Profit Organization)
Delivery Time: 1-5 Working Days
Get ISO Certified Research, Customization, Data Extraction, and Value-Added Services with All BIS Research Reports
BIS Research provides a comprehensive report library with unlimited access to data, insights, and market intelligence through Subscription.
Get Subscription Know More
1.1 Scope of the Report
1.2 Global CubeSat Market Research Methodology
1.2.1 Primary Data Sources
1.2.2 Secondary Data Sources
1.2.3 Assumptions and Limitations
2.1 Drivers
2.1.1 Extensive Demand for Small Satellite Constellations
2.1.2 Technological Expansion in Electronic Components for CubeSats
2.1.3 Imminent Need for Satellite Miniaturization in the Space Industry
2.1.4 Increase in Space Missions for Academic Research
2.2 Challenges
2.2.1 Lack of Affordability in Launching CubeSats
2.2.2 Lack of Regulation for the Increasing Amount of Space Debris
2.3 Opportunities
2.3.1 Demand for IoT and M2M Small Satellite Networks
2.3.2 Disaster Management Through Satellite Remote Sensing
3.1 Key Market Developments and Strategies
3.1.1 Recent Product Launches
3.1.2 Partnerships, Joint Ventures, and Collaborations
3.1.3 Mergers and Acquisitions
3.1.4 Others
3.2 Market Share Analysis and Competitive Benchmarking
4.1 Evolution of CubeSats and Technological Advancements Over Conventional Satellites
4.2 Manufacturing Cost Analysis of CubeSats
4.3 Regulatory Environment: CubeSat Industry
4.4 Patent Analysis
4.5 Value Chain Analysis
5.1 Assumptions and Limitations
5.2 Market Overview
5.2.1 Market Definition
6.1 Market Overview
6.2 1U CubeSat
6.2.1 1U CubeSat Market Analysis by End User
6.3 2U CubeSat
6.3.1 2U CubeSat Market Analysis by End User
6.4 3U CubeSat
6.4.1 3U CubeSat Market Analysis by End User
6.5 6U CubeSat
6.5.1 6U CubeSat Market Analysis by End User
6.6 Other Sizes CubeSat
6.6.1 Other Sizes CubeSat Market Analysis by End User
7.1 Market Overview
7.2 Payload
7.3 Structure
7.4 Telecommunication: Telemetry, Tracking, and Command (TT&C)
7.5 On-Board Computer: Command and Data Handling (C&DH)
7.6 Power System
7.7 Attitude Control System: Attitude Determination and Control System (ADCS)
7.8 Propulsion System
7.9 Thermal Control System (TCS)
8.1 Market Overview
8.2 Academic
8.2.1 CubeSat Market Analysis for Academic End User by Application
8.3 Commercial
8.3.1 CubeSat Market Analysis for Commercial End-User by Application
8.4 Government
8.4.1 CubeSat Market Analysis for Government End-User by Application
8.5 Defense
8.5.1 CubeSat Market Analysis for Defense End-User by Application
8.6 Non-Profit Organization
8.6.1 CubeSat Market Analysis for Non-Profit Organization End-User by Application
9.1 Market Overview
9.2 North America CubeSat Market
9.2.1 The U.S.
9.2.2 Canada
9.3 Europe CubeSat Market
9.3.1 The U.K.
9.3.2 Germany
9.3.3 France
9.3.4 Russia
9.3.5 Italy
9.3.6 Spain
9.3.7 Rest of Europe
9.4 Asia-Pacific CubeSat Market
9.4.1 China
9.4.2 India
9.4.3 Japan
9.4.4 Rest of Asia-Pacific
9.5 Rest of the World (RoW) CubeSat Market
9.5.1 Middle East
9.5.2 Latin America
9.5.3 Africa
10.1 Booming SmallSat Market and Role of Dedicated Small Launch Vehicles
11.1 Clyde Space Ltd.
11.1.1 Company Overview
11.1.2 Product Offerings
11.1.3 Corporate Summary
11.1.4 SWOT Analysis
11.2 EnduroSat AD
11.2.1 Company Overview
11.2.2 Product Offerings
11.2.3 Corporate Summary
11.2.4 SWOT Analysis
11.3 GomSpace A/S
11.3.1 Company Overview
11.3.2 Product Offerings
11.3.3 Financials
11.3.4 Financial Summary
11.3.5 SWOT Analysis
11.4 Group of Astrodynamics for the Use of Space Systems (G.A.U.S.S.) Srl
11.4.1 Company Overview
11.4.2 Product Offerings
11.4.3 Corporate Summary
11.4.4 SWOT Analysis
11.5 Harris Corporation
11.5.1 Company Overview
11.5.2 Product Offerings
11.5.3 Financials
11.5.4 Financial Summary
11.5.5 SWOT Analysis
11.6 Innovative Solutions in Space BV (ISIS)
11.6.1 Company Overview
11.6.2 Product Offerings
11.6.3 Corporate Summary
11.6.4 SWOT Analysis
11.7 Interorbital Systems Corporation (IOS)
11.7.1 Company Overview
11.7.2 Product Offerings
11.7.3 Corporate Summary
11.7.4 SWOT Analysis
11.8 NanoAvionika, LLC
11.8.1 Company Overview
11.8.2 Product Offerings
11.8.3 Corporate Summary
11.8.4 SWOT Analysis
11.9 Space Systems/Loral, LLC (SSL)
11.9.1 Company Overview
11.9.2 Product Offerings
11.9.3 Corporate Summary
11.9.4 SWOT Analysis
11.1 Tyvak Nano-Satellite Systems, Inc.
11.10.1 Company Overview
11.10.2 Product Offerings
11.10.3 SWOT Analysis
11.11 Other Key Players
12.1 Related Reports
Figure 1 CubeSat Launches by Different End Users (2014–2017)
Figure 2 Global CubeSat Market by Value and Volume 2016-2022
Figure 3 Global CubeSat Market by Size, 2016-2022
Figure 4 Global CubeSat Market by Subsystem, 2016–2022
Figure 5 Global CubeSat Market by End User, 2016-2022
Figure 6 Global CubeSat Market by Region, 2016-2022
Figure 1.1 Global CubeSat Market Segmentation
Figure 1.2 Secondary Data Sources
Figure 1.3 Top-Down and Bottom-Up Approach
Figure 1.4 Global CubeSat Market Influencing Factors
Figure 1.5 Assumptions and Limitations
Figure 2.1 Global CubeSat Market: Impact Analysis of Market Drivers, Challenges, and Opportunities
Figure 2.2 CubeSats: Technological Growth Roadmap
Figure 2.3 Worldwide Academic Research Organizations
Figure 2.4 Number of Debris in Earth Orbit, 1990-2018
Figure 2.5 CubeSats: Remote Sensing for Disaster Management
Figure 3.1 Some of the Organic and Inorganic Growth Strategies Adopted in the Market
Figure 3.2 Share of Key Developments and Strategies
Figure 3.3 CubeSat Market: Market Share Analysis, 2016 and 2017
Figure 3.4 CubeSat Market: Competitive Benchmarking
Figure 4.1 CubeSat Evolution
Figure 4.2 CubeSat System vs. Traditional Satellite System
Figure 4.3 Impacts of CubeSat Technological Developments on the Mission Cost
Figure 4.4 1U and >6U CubeSats: Manufacturing Cost Analysis by Subsystems, 2017 and 2022
Figure 4.5 CubeSat Project: Space-Specific Legal and Regulatory Issues
Figure 4.6 Percentage of Patents Published in Global CubeSat Market: 2010-2017
Figure 4.7 CubeSat: Value Chain Analysis
Figure 4.8 CubeSat: Upstream and Downstream Process
Figure 4.9 CubeSat: Manufacturing Cost Scenario with Respect to Different Subsystems
Figure 5.1 Global CubeSat Market by Value and Volume, 2016-2022
Figure 6.1 Classification of CubeSat Market by Size
Figure 6.2 Global CubeSat Market by Size, 2017 and 2022 ($Million)
Figure 6.3 1U CubeSat Launches in 2017
Figure 6.4 Global 1U CubeSat Market Value and Volume, 2016-2022
Figure 6.5 Global 1U CubeSat Market by End User, 2017 and 2022
Figure 6.6 Company Analysis for 1U CubeSat Market by End User
Figure 6.7 2U CubeSat Launches in 2017
Figure 6.8 Global 2U CubeSat Market Value and Volume, 2016-2022
Figure 6.9 Global 2U CubeSat Market by End User, 2017 and 2022
Figure 6.10 Company Analysis for 2U CubeSat Market by End User
Figure 6.11 3U CubeSat Launches in 2017
Figure 6.12 Global 3U CubeSat Market Value and Volume, 2016-2022
Figure 6.13 Global 3U CubeSat Market by End User, 2017 and 2022
Figure 6.14 Company Analysis for 3U CubeSat Market by End User
Figure 6.15 6U CubeSat Launches in 2017
Figure 6.16 Global 6U CubeSat Market Value and Volume, 2016-2022
Figure 6.17 Global 6U CubeSat Market by End User, 2017 and 2022
Figure 6.18 Company Analysis for 6U CubeSat Market by End User
Figure 6.19 Other Sizes CubeSat Launches in 2017
Figure 6.20 Global Other Sizes CubeSat Market Value and Volume, 2016-2022
Figure 6.21 Global Other Sizes CubeSat Market by End User, 2017 and 2022
Figure 6.22 Company Analysis for Other Sizes CubeSat Market by End User
Figure 7.1 Classification of CubeSat Market by Subsystem
Figure 7.2 Global CubeSat Market by Subsystem, 2017 and 2022 ($Million)
Figure 7.3 Global CubeSat Market by Payload, 2016-2022
Figure 7.4 Global CubeSat Market by Structure, 2016-2022
Figure 7.5 Global CubeSat Market by Telecommunication, 2016-2022
Figure 7.6 Global CubeSat Market by On-Board Computer, 2016-2022
Figure 7.7 Global CubeSat Market by Power System, 2016-2022
Figure 7.8 Global CubeSat Market by Attitude Control System, 2016-2022
Figure 7.9 Global CubeSat Market by Propulsion System, 2016-2022
Figure 7.10 Global CubeSat Market by Thermal Control System, 2016-2022
Figure 8.1 Classification of CubeSat Market by End User
Figure 8.2 Global CubeSat Market by End User, 2017 and 2022 ($Million)
Figure 8.3 CubeSat Launches by Academic End Users, 2014-2020
Figure 8.4 Global CubeSat Market by Academic End User, 2016-2022
Figure 8.5 CubeSat Market for Academic End User by Application, 2016 - 2022
Figure 8.6 CubeSat Launches by Commercial End Users, 2014-2020
Figure 8.7 Global CubeSat Market by Commercial End User, 2016-2022
Figure 8.8 CubeSat Market for Commercial End-User by Application, 2016-2022
Figure 8.9 CubeSat Launches by Government End Users, 2014-2020
Figure 8.10 Global CubeSat Market by Government End-User, 2016-2022
Figure 8.11 CubeSat Market for Government End User by Application, 2016-2022
Figure 8.12 CubeSat Launches by Defense End Users, 2015-2020
Figure 8.13 Global CubeSat Market by Defense End User, 2016-2022
Figure 8.14 CubeSat Market for Defense End User by Application, 2016-2022
Figure 8.15 CubeSat Launches by Non-Profit Organization End Users, 2015-2019
Figure 8.16 Global CubeSat Market by Non-Profit Organization End-User, 2016-2022
Figure 8.17 CubeSat Market for Non-Profit Organization End-User by Application, 2016-2022
Figure 9.1 Classification of CubeSat Market by Region
Figure 9.2 Global CubeSat Market by Region
Figure 9.3 North America CubeSat Market by Country
Figure 9.4 Key Factors Driving the CubeSat Market in the U.S.
Figure 9.5 U.S. CubeSat Market Size, 2016-2022 ($Million)
Figure 9.6 Key Factors Driving the CubeSat Market in Canada
Figure 9.7 Canada CubeSat Market Size, 2016-2022 ($Million)
Figure 9.8 Europe CubeSat Market by Country
Figure 9.9 Key Factors Driving the CubeSat Market in the U.K.
Figure 9.10 The U.K. CubeSat Market Size, 2016-2022 ($Million)
Figure 9.11 Key Factors Driving the CubeSat Market in Germany
Figure 9.12 Germany CubeSat Market Size, 2016-2022 ($Million)
Figure 9.13 Key Factors Driving the CubeSat market in France
Figure 9.14 France CubeSat Market Size, 2016-2022 ($Million)
Figure 9.15 Key Factors Driving the CubeSat Market in Russia
Figure 9.16 Russia CubeSat Market Size, 2016-2022 ($Million)
Figure 9.17 Key Factors Driving the CubeSat market in Italy
Figure 9.18 Italy CubeSat Market Size, 2016-2022 ($Million)
Figure 9.19 Key Factors Driving the CubeSat Business in Spain
Figure 9.20 Spain CubeSat Market Size, 2016-2022 ($Million)
Figure 9.21 Key Factors Driving the CubeSat Business in Rest of the Europe
Figure 9.22 Rest of Europe CubeSat Market Size, 2016-2022 ($Million)
Figure 9.23 Asia-Pacific CubeSat Market by Country
Figure 9.24 Key Factors Driving the CubeSat Business in China
Figure 9.25 China CubeSat Market Size, 2016-2022 ($Million)
Figure 9.26 Key Factors Driving the CubeSat Business in India
Figure 9.27 India CubeSat Market Size, 2016-2022 ($Million)
Figure 9.28 Key Factors Driving the CubeSat Market in Japan
Figure 9.29 Japan CubeSat Market Size, 2016-2022 ($Million)
Figure 9.30 Key Factors Driving the CubeSat market in Rest of Asia-Pacific
Figure 9.31 Rest of Asia-Pacific CubeSat Market Size, 2016-2022 ($Million)
Figure 9.32 Rest of the World CubeSat Market by Region
Figure 9.33 Key Factors Driving the CubeSat Business in Middle East
Figure 9.34 Middle East CubeSat Market Size, 2016-2022 ($Million)
Figure 9.35 Key Factors Driving the CubeSat Business in Latin America
Figure 9.36 Latin America CubeSat Market Size, 2016-2022 ($Million)
Figure 9.37 Key Factors Driving the CubeSat Business in Africa
Figure 9.38 Africa CubeSat Market Size, 2016-2022 ($Million)
Figure 10.1 Prominent Small Launch Vehicles for CubeSats
Figure 10.2 Global Small Launch Vehicle Market, 2016-2026
Figure 11.1 Clyde Space Ltd.: Product Offerings
Figure 11.2 Clyde Space Ltd.: SWOT Analysis
Figure 11.3 EnduroSat AD: Product Offerings
Figure 11.4 EnduroSat AD: SWOT Analysis
Figure 11.5 GomSpace A/S: Product Offerings
Figure 11.6 GomSpace A/S – Overall Financials, 2014-2016
Figure 11.7 GomSpace A/S – Share in Overall Revenue, by Region, 2014-2016
Figure 11.8 GomSpace A/S: SWOT Analysis
Figure 11.9 G.A.U.S.S. Srl: Product Offerings
Figure 11.10 G.A.U.S.S. Srl: SWOT Analysis
Figure 11.11 Harris Corporation: Product Offerings
Figure 11.12 Harris Corporation – Overall Financials, 2014-2016
Figure 11.13 Harris Corporation – Revenue by Business Segment, 2015-2017
Figure 11.14 Harris Corporation – Share in Overall Revenue, by Region, 2014-2016
Figure 11.15 Harris Corporation: SWOT Analysis
Figure 11.16 Innovative Solutions in Space BV: Product Offerings
Figure 11.17 Innovative Solutions in Space BV: SWOT Analysis
Figure 11.18 Interorbital Systems Corporation: Product Offerings
Figure 11.19 Interorbital Systems Corporation: SWOT Analysis
Figure 11.20 NanoAvionika, LLC: Product Offerings
Figure 11.21 NanoAvionika, LLC: SWOT Analysis
Figure 11.22 Space Systems/Loral, LLC: Product Offerings
Figure 11.23 Space Systems/Loral, LLC: SWOT Analysis
Figure 11.24 Tyvak Nano-Satellite Systems, Inc.: Product Offerings
Figure 11.25 Tyvak Nano-Satellite Systems, Inc.: SWOT Analysis
• What was the size, in terms of revenue and volume, of the CubeSat market in 2016 and 2017, and what will be the growth rate during the period, 2016-2022?
• What is the market size of different sizes of CubeSats, including 1U, 2U, 3U, 6U, and other sizes? Furthermore, what is the market size of different end users for every size of CubeSat?
• What was the market value of different subsystems of CubeSats in 2016 and 2017? What are the technological advancements and opportunities for the stakeholders for different subsystems?
• What is the is the market analysis of end users of CubeSat such as academic, government, defense, non-profit organization, and commercial, including IT & telecommunication, agriculture, oil & gas, and mining?
• What is the market analysis of end users of CubeSat, on the basis of different applications, including communication, Intelligence, Surveillance, & Reconnaissance (ISR), earth observation & remote sensing, academic research & space exploration, navigation, and technology demonstration?
• What is the market size of CubeSats on the basis of different geographical regions and the respective leading nations?
• What are the key trends and opportunities in the CubeSat market, across different regions and respective countries?
• What are the major driving forces that are expected to increase the demand of CubeSats during the forecast period?
• What are the major challenges inhibiting the growth of the global CubeSat market?
• What kind of new strategies are being adopted by the existing market players to make a mark in the CubeSat industry?
• What is the competitive strength of the key players in the CubeSat market by analyzing through market share analysis and competitive benchmarking model?
• The report also provides industry insights through patent analysis, value chain model, and manufacturing cost analysis
• Additionally, detailed analysis and profiling of key market players have been covered in the report. Furthermore, company profile section covers the business financials, company snapshots, key products & services, major developments, SWOT analysis and future programs (if any) of 10 leading players in the market
The CubeSat market has witnessed a high growth rate owing to the extensive demand of small satellite constellations, technological expansion in electronic components for CubeSats, imminent need for satellite miniaturization in the space industry, and increase in the number of space missions for academic research. Recent innovations in satellite equipment and services enable the CubeSat technology to reach a wider segment of consumers in the industry. Recent innovations in CubeSat subsystems have enabled them to reach a wider segment of consumers in the satellite industry. The companies are developing relatively low-cost CubeSats, which facilitate services almost equivalent to the traditional big satellites that serve government agencies or public-sector industries. This, in effect, is expected to increase competition in the near future as well as facilitate the utilization of CubeSats for varied applications.
Increasing demand for Internet of Things (IoT) and Machine-to-Machine (M2M) small satellite networks and disaster management through satellite remote sensing are the major factors which are expected to create lucrative opportunities for the market in the next five years. In terms of revenue, the CubeSats market generated $363.8 million in the year 2017.
During initial years of the development of satellite technologies, the main focus of companies was on developing heavy- and large-sized satellites. Although, over a period of time, the satellite industry has witnessed several significant technological advancements which have created extensive demand for small size satellites as well as cost-effective launch solutions. Small satellites include CubeSats, which are special types of cuboid-shaped smallsats, created in units of a 10cm × 10cm × 10cm cube. The market of CubeSats is expected to show robust growth rate due to increasing rate of investments in the space industry by the government organizations. A major advantage with CubeSats is that they allow business & scientific establishments, educational institutions, non-spacefaring states, non-profit organizations, and even individuals an easy access to space. However, there are several market factors that will define the dynamics of the CubeSat industry in the next five years.
Clyde Space Ltd., EnduroSat AD, GomSpace A/S, Group of Astrodynamics for the Use of Space Systems (G.A.U.S.S.) Srl, Harris Corporation, Innovative Solutions in Space BV (ISIS), Interorbital Systems Corporation, NanoAvionika, LLC, Space Systems/Loral, LLC, and Tyvak Nano-Satellite Systems, Inc. are some of the major players of the CubeSat market.
Extensive demand for small satellite constellations, technological expansion in electronic components for CubeSats, imminent need for satellite miniaturization in the space industry, and increase in space missions for academic research are driving the growth of the market. Moreover, affordable launch of CubeSats and regulate the increasing amount of space debris act as major challenges to the market. Furthermore, demand for IoT and M2M small satellite networks and disaster management through satellite remote sensing are expected to create lucrative opportunities for the market in coming years. Each of these factors has a definite impact on the growth of the market. The CubeSat market reported a revenue of $363.8 million in 2017, and the commercial end user is expected to generate the highest revenue by 2022.
Commercial end user had the highest market penetration rate in the overall CubeSat market in 2016, followed by academic, government, and defense. The commercial end user is expected to witness a high growth rate owing to increasing research and development (R&D) activities to develop CubeSat constellation for varied applications such as navigation, provision of global wireless internet system, and telecommunication, among others.
The demand for CubeSats across different geographies in the near future is expected to be promising, with North America having the highest market share during the period 2016-2022, followed by Asia-Pacific, Europe, and Rest of the World. North America is expected to maintain its dominance through the forecast period, owing to maximum number of CubeSat launches by the commercial end user in the region. In addition to this, the emerging start-ups in the region are also keen to develop CubeSats for the emerging applications for varied end users, thus, boosting the utilization of CubeSats for commercial and academic.
Focus on Sizes (1U, 2U, 3U, 6U, and Other Sizes),Subsystems, and End Users (Academic, Commercial, Government, Defense,and Non-Profit Organization)
The small satellites market reported a revenue of $2,528.1 million in 2016, and the government...

The small launch vehicle market is witnessing a high growth rate owing to increase in...
The global fixed-wing VTOL aircraft market reported a revenue of $1,982.5 million in 2016....
The demand for nano satellites is globally expected to increase during the forecast period due...
1. Please contact us to discuss customization options, and we can confirm the time and cost (if any). For minor customization requirements that would take 3-5 days, we do not charge any additional amount.
2. All BIS Research reports are delivered to clients via our InsightMonk platform. This allows the customers to extract the data in Excel for their use. Excel is provided for all License types and is not limited to just enterprise users.
3. Additionally, all customers also get access to the following complimentary value-added services from BIS Research.
*Expert Consultation Charges applicable