Published Year: 2023
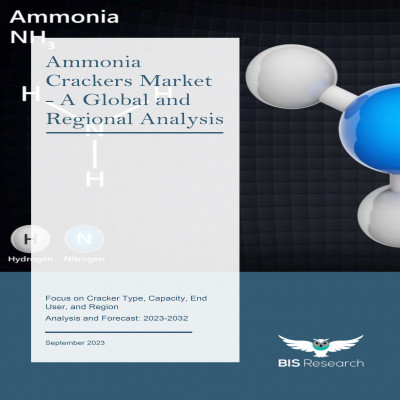
Ammonia Crackers Market - A Global and Regional Analysis: Focus on Cracker Type, Capacity, End User,
The global ammonia crackers market is projected to reach $1,574.44 million by 2032 from...
Focus on Cracker Type, Capacity, End User, and Country - Analysis and Forecast, 2023-2032
Delivery Time: 1 Working Day
Get ISO Certified Research, Customization, Data Extraction, and Value-Added Services with All BIS Research Reports
BIS Research provides a comprehensive report library with unlimited access to data, insights, and market intelligence through Subscription.
Get Subscription Know MoreFocus on Cracker Type, Capacity, End User, and Country - Analysis and Forecast, 2023-2032
In 2022, Europe took the lead in the ammonia crackers market. The region's dominant presence in manufacturing, especially in the metal industry, heat treatment, mobility, and various other sectors, played a crucial role in this achievement. The significant contributions of industry giants such as Siemens Energy and thyssenkrupp AG, which are deeply embedded in the ammonia crackers supply chain, have notably enhanced the market's growth potential in the European region.
Ammonia crackers are defined as equipment or systems used to crack ammonia for the production of forming gas (hydrogen and nitrogen). It is a catalytic cracking unit in which ammonia (NH3) is disassociated to hydrogen and nitrogen in a cost-effective way in a volume ratio of 3:1 or in a weight ratio of 14:3.
Ongoing research for scaling up cracking technologies and transitioning to low-carbon hydrogen are the key trends in the ammonia crackers market.
This technology enables the maximum conversion of ammonia into hydrogen with no direct emissions of CO2. Ammonia cracking is a valuable addition to Air Liquide's extensive range of hydrogen technologies, further expanding their technological solutions to support the advancement of a global hydrogen market
Ammonia cracking is a technology used to crack ammonia into hydrogen and nitrogen. Ammonia is widely used as a means of hydrogen carrier as transportation of gaseous hydrogen is difficult. Hydrogen can be transported as ammonia and then again cracked to hydrogen at the point of use.
An Ammonia Cracking Unit is the equipment employed to generate Hydrogen and Nitrogen gases using a Nickel catalyst. This fuel possesses multiple favorable attributes that make it a promising candidate for hydrogen storage, as it produces hydrogen (H2) alongside nitrogen (N2), both of which are non-toxic and non-greenhouse gases.
In contrast to methanol, ammonia contains no carbon whatsoever. Absolutely none. When produced exclusively with renewable energy, it transforms into a carbon-free fuel.
Ammonia boasts a greater energy density, measuring 12.7 MJ/L, surpassing even the energy density of liquid hydrogen, which stands at 8.5 MJ/L. While liquid hydrogen necessitates cryogenic storage conditions at a chilling -253 °C, ammonia can be stored at a far less energy-intensive -33 °C. Furthermore, although ammonia requires careful handling due to its hazardous nature, it is notably less flammable compared to hydrogen.
The global ammonia crackers market is projected to reach $1,574.44 million by 2032 from...
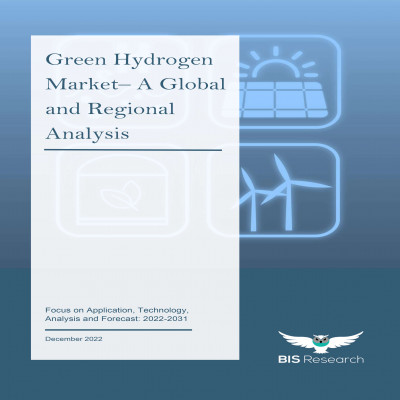
The global green hydrogen market was valued at $227.7 million in 2021 and is projected to...
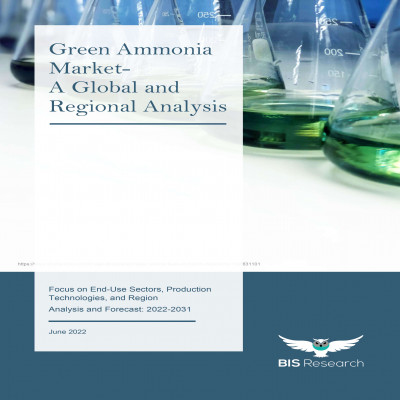
The global green ammonia market is expected to reach $18,801.0 million by 2031, with a CAGR of...