A quick peek into the report
Table of Contents
1.1 Trends: Current and Future Impact Assessment
1.1.1 Integration of Artificial Intelligence and Machine Learning for Predictive Data Analytics
1.1.2 Edge and Next-Gen Networks Driving Real-Time Control
1.2 Stakeholder Analysis
1.2.1 Use Case
1.2.2 End User and Buying Criteria
1.3 Market Dynamics
1.3.1 Market Drivers
1.3.1.1 Regulatory and Buyer Traceability Requirements
1.3.1.2 Climate Volatility and Water Scarcity
1.3.2 Market Challenges
1.3.2.1 Infrastructure and Reliability Barriers to Scalable Data Logging
1.3.2.2 Trust and Value Gaps in Farm Data Logging
1.3.3 Market Opportunities
1.3.3.1 Building Verified Sustainability Claims with Agricultural Data Logging
1.3.3.2 Linking Data Logging with Parametric Insurance for Climate Resilience
1.4 Regulatory and Policy Impact Analysis
1.5 Patent Filing Trend (by Country and Company)
1.6 Startup Landscape
2.1 Application Summary
2.2 Automated Data Logging Tools and Systems Market (by Application)
2.2.1 Field Crop Monitoring
2.2.2 Irrigation and Fertigation Control System
2.2.3 Environmental Monitoring
2.2.4 Others
3.1 Product Summary
3.2 Automated Data Logging Tools and Systems Market (by Product Type)
3.2.1 Product Type – Hardware
3.2.1.1 Standalone Data Loggers
3.2.1.2 Multi-Sensor Logging Units
3.2.1.3 Sensor + Telemetry Modules
3.2.1.4 Automated Control Systems
3.2.2 Product Type - Software
3.2.2.1 IoT-Based Data Logging Platforms
3.2.2.2 Decision Support and Analytics Platforms (AI/ML)
4.1 Regional Summary
4.2 North America
4.2.1 Regional Overview
4.2.2 Driving Factors for Market Growth
4.2.3 Factors Challenging the Market
4.2.4 Analyst View
4.2.4.1 Application
4.2.4.2 Product
4.2.5 U.S.
4.2.5.1 Application
4.2.5.2 Product
4.2.6 Canada
4.2.6.1 Application
4.2.6.2 Product
4.2.7 Mexico
4.2.7.1 Application
4.2.7.2 Product
4.3 Europe
4.3.1 Regional Overview
4.3.2 Driving Factors for Market Growth
4.3.3 Factors Challenging the Market
4.3.4 Analyst View
4.3.4.1 Application
4.3.4.2 Product
4.3.5 Germany
4.3.5.1 Application
4.3.5.2 Product
4.3.6 France
4.3.6.1 Application
4.3.6.2 Product
4.3.7 U.K.
4.3.7.1 Application
4.3.7.2 Product
4.3.8 Italy
4.3.8.1 Application
4.3.8.2 Product
4.3.9 Spain
4.3.9.1 Application
4.3.9.2 Product
4.3.10 Rest-of-Europe
4.3.10.1 Application
4.3.10.2 Product
4.4 Asia-Pacific
4.4.1 Regional Overview
4.4.2 Driving Factors for Market Growth
4.4.3 Factors Challenging the Market
4.4.4 Analyst View
4.4.4.1 Application
4.4.4.2 Product
4.4.5 China
4.4.5.1 Application
4.4.5.2 Product
4.4.6 Japan
4.4.6.1 Application
4.4.6.2 Product
4.4.7 India
4.4.7.1 Application
4.4.7.2 Product
4.4.8 South Korea
4.4.8.1 Application
4.4.8.2 Product
4.4.9 Australia
4.4.9.1 Application
4.4.9.2 Product
4.4.10 Rest-of-Asia-Pacific
4.4.10.1 Application
4.4.10.2 Product
4.5 Rest-of-the-World
4.5.1 Regional Overview
4.5.2 Driving Factors for Market Growth
4.5.3 Factors Challenging the Market
4.5.4 Analyst View
4.5.4.1 Application
4.5.4.2 Product
4.5.5 South America
4.5.5.1 Application
4.5.5.2 Product
4.5.6 Middle East and Africa
4.5.6.1 Application
4.5.6.2 Product
5.1 Onset Computer Corporation (HOBO)
5.1.1 Overview
5.1.2 Top Products/Product Portfolio
5.1.3 Top Competitors
5.1.4 Target Customers
5.1.5 Key Personnel
5.1.6 Analyst View
5.1.7 Market Share, 2024
5.2 Riot Technology Corporation (Gropoint)
5.2.1 Overview
5.2.2 Top Products/Product Portfolio
5.2.3 Top Competitors
5.2.4 Target Customers
5.2.5 Key Personnel
5.2.6 Analyst View
5.2.7 Market Share, 2024
5.3 Gemini Data Loggers (TinyTag)
5.3.1 Overview
5.3.2 Top Products/Product Portfolio
5.3.3 Top Competitors
5.3.4 Target Customers
5.3.5 Key Personnel
5.3.6 Analyst View
5.3.7 Market Share, 2024
5.4 Delta-T-Devices
5.4.1 Overview
5.4.2 Top Products/Product Portfolio
5.4.3 Top Competitors
5.4.4 Target Customers
5.4.5 Key Personnel
5.4.6 Analyst View
5.4.7 Market Share, 2024
5.5 Irrometer Company Inc.
5.5.1 Overview
5.5.2 Top Products/Product Portfolio
5.5.3 Top Competitors
5.5.4 Target Customers
5.5.5 Key Personnel
5.5.6 Analyst View
5.5.7 Market Share, 2024
5.6 Sentek Technologies
5.6.1 Overview
5.6.2 Top Products/Product Portfolio
5.6.3 Top Competitors
5.6.4 Target Customers
5.6.5 Key Personnel
5.6.6 Analyst View
5.6.7 Market Share, 2024
5.7 Lascar Electronics (Easylog)
5.7.1 Overview
5.7.2 Top Products/Product Portfolio
5.7.3 Top Competitors
5.7.4 Target Customers
5.7.5 Key Personnel
5.7.6 Analyst View
5.7.7 Market Share, 2024
5.8 Campbell Scientific Inc.
5.8.1 Overview
5.8.2 Top Products/Product Portfolio
5.8.3 Top Competitors
5.8.4 Target Customers
5.8.5 Key Personnel
5.8.6 Analyst View
5.8.7 Market Share, 2024
5.9 Munro Instruments
5.9.1 Overview
5.9.2 Top Products/Product Portfolio
5.9.3 Top Competitors
5.9.4 Target Customers
5.9.5 Key Personnel
5.9.6 Analyst View
5.9.7 Market Share, 2024
5.1 Spectrum Technologies (Watchdog)
5.10.1 Overview
5.10.2 Top Products/Product Portfolio
5.10.3 Top Competitors
5.10.4 Target Customers
5.10.5 Key Personnel
5.10.6 Analyst View
5.10.7 Market Share, 2024
5.11 MicroEdge Instruments Inc.
5.11.1 Overview
5.11.2 Top Products/Product Portfolio
5.11.3 Top Competitors
5.11.4 Target Customers
5.11.5 Key Personnel
5.11.6 Analyst View
5.11.7 Market Share, 2024
5.12 METER Group
5.12.1 Overview
5.12.2 Top Products/Product Portfolio
5.12.3 Top Competitors
5.12.4 Target Customers
5.12.5 Key Personnel
5.12.6 Analyst View
5.12.7 Market Share, 2024
5.13 PCE Instruments
5.13.1 Overview
5.13.2 Top Products/Product Portfolio
5.13.3 Top Competitors
5.13.4 Target Customers
5.13.5 Key Personnel
5.13.6 Analyst View
5.13.7 Market Share, 2024
5.14 STEP Systems GmbH
5.14.1 Overview
5.14.2 Top Products/Product Portfolio
5.14.3 Top Competitors
5.14.4 Target Customers
5.14.5 Key Personnel
5.14.6 Analyst View
5.14.7 Market Share, 2024
5.15 ThingsLog
5.15.1 Overview
5.15.2 Top Products/Product Portfolio
5.15.3 Top Competitors
5.15.4 Target Customers
5.15.5 Key Personnel
5.15.6 Analyst View
5.15.7 Market Share, 2024
6.1 Data Sources
6.1.1 Primary Data Sources
6.1.2 Secondary Data Sources
6.1.3 Data Triangulation
6.2 Market Estimation and Forecast
Table 1: Market Snapshot
Table 2: Competitive Landscape Snapshot
Table 3: Trends: Current and Future Impact Assessment
Table 4: Integration of Artificial Intelligence and Machine Learning for Predictive Data Analytics
Table 5: Key Operational Use Cases for Automated Data Logging Tools and Systems Market
Table 6: Primary End Users of Automated Data Logging Tools and Systems Market and their Operational Focus
Table 7: Automated Data Logging Tools and Systems Procurement Drivers – Core Buying Criteria and Industry Examples
Table 8: Drivers, Challenges, and Opportunities, 2024-2035
Table 9: Regulatory and Policy Impact Analysis
Table 10: Startup Landscape
Table 11: Automated Data Logging Tools and Systems Market (by Region), $Million, 2024-2035
Table 12: Automated Data Logging Tools and Systems Market (by Region), Units, 2024-2035
Table 13: North America Automated Data Logging Tools and Systems Market (by Application), $Million, 2024-2035
Table 14: North America Automated Data Logging Tools and Systems Market (by Application), Units, 2024-2035
Table 15: North America Automated Data Logging Tools and Systems Market (by Hardware), $Million, 2024-2035
Table 16: North America Automated Data Logging Tools and Systems Market (by Hardware), Units, 2024-2035
Table 17: North America Automated Data Logging Tools and Systems Market (by Software), $Million, 2024-2035
Table 18: U.S. Automated Data Logging Tools and Systems Market (by Application), $Million, 2024-2035
Table 19: U.S. Automated Data Logging Tools and Systems Market (by Application), Units, 2024-2035
Table 20: U.S. Automated Data Logging Tools and Systems Market (by Hardware), $Million, 2024-2035
Table 21: U.S. Automated Data Logging Tools and Systems Market (by Hardware), Units, 2024-2035
Table 22: U.S. Automated Data Logging Tools and Systems Market (by Software), $Million, 2024-2035
Table 23: Canada Automated Data Logging Tools and Systems Market (by Application), $Million, 2024-2035
Table 24: Canada Automated Data Logging Tools and Systems Market (by Application), Units, 2024-2035
Table 25: Canada Automated Data Logging Tools and Systems Market (by Hardware), $Million, 2024-2035
Table 26: Canada Automated Data Logging Tools and Systems Market (by Hardware), Units, 2024-2035
Table 27: Canada Automated Data Logging Tools and Systems Market (by Software), $Million, 2024-2035
Table 28: Mexico Automated Data Logging Tools and Systems Market (by Application), $Million, 2024-2035
Table 29: Mexico Automated Data Logging Tools and Systems Market (by Application), Units, 2024-2035
Table 30: Mexico Automated Data Logging Tools and Systems Market (by Hardware), $Million, 2024-2035
Table 31: Mexico Automated Data Logging Tools and Systems Market (by Hardware), Units, 2024-2035
Table 32: Mexico Automated Data Logging Tools and Systems Market (by Software), $Million, 2024-2035
Table 33: Europe Automated Data Logging Tools and Systems Market (by Application), $Million, 2024-2035
Table 34: Europe Automated Data Logging Tools and Systems Market (by Application), Units, 2024-2035
Table 35: Europe Automated Data Logging Tools and Systems Market (by Hardware), $Million, 2024-2035
Table 36: Europe Automated Data Logging Tools and Systems Market (by Hardware), Units, 2024-2035
Table 37: Europe Automated Data Logging Tools and Systems Market (by Software), $Million, 2024-2035
Table 38: Germany Automated Data Logging Tools and Systems Market (by Application), $Million, 2024-2035
Table 39: Germany Automated Data Logging Tools and Systems Market (by Application), Units, 2024-2035
Table 40: Germany Automated Data Logging Tools and Systems Market (by Hardware), $Million, 2024-2035
Table 41: Germany Automated Data Logging Tools and Systems Market (by Hardware), Units, 2024-2035
Table 42: Germany Automated Data Logging Tools and Systems Market (by Software), $Million, 2024-2035
Table 43: France Automated Data Logging Tools and Systems Market (by Application), $Million, 2024-2035
Table 44: France Automated Data Logging Tools and Systems Market (by Application), Units, 2024-2035
Table 45: France Automated Data Logging Tools and Systems Market (by Hardware), $Million, 2024-2035
Table 46: France Automated Data Logging Tools and Systems Market (by Hardware), Units, 2024-2035
Table 47: France Automated Data Logging Tools and Systems Market (by Software), $Million, 2024-2035
Table 48: U.K. Automated Data Logging Tools and Systems Market (by Application), $Million, 2024-2035
Table 49: U.K. Automated Data Logging Tools and Systems Market (by Application), Units, 2024-2035
Table 50: U.K. Automated Data Logging Tools and Systems Market (by Hardware), $Million, 2024-2035
Table 51: U.K. Automated Data Logging Tools and Systems Market (by Hardware), Units, 2024-2035
Table 52: U.K. Automated Data Logging Tools and Systems Market (by Software), $Million, 2024-2035
Table 53: Italy Automated Data Logging Tools and Systems Market (by Application), $Million, 2024-2035
Table 54: Italy Automated Data Logging Tools and Systems Market (by Application), Units, 2024-2035
Table 55: Italy Automated Data Logging Tools and Systems Market (by Hardware), $Million, 2024-2035
Table 56: Italy Automated Data Logging Tools and Systems Market (by Hardware), Units, 2024-2035
Table 57: Italy Automated Data Logging Tools and Systems Market (by Software), $Million, 2024-2035
Table 58: Spain Automated Data Logging Tools and Systems Market (by Application), $Million, 2024-2035
Table 59: Spain Automated Data Logging Tools and Systems Market (by Application), Units, 2024-2035
Table 60: Spain Automated Data Logging Tools and Systems Market (by Hardware), $Million, 2024-2035
Table 61: Spain Automated Data Logging Tools and Systems Market (by Hardware), Units, 2024-2035
Table 62: Spain Automated Data Logging Tools and Systems Market (by Software), $Million, 2024-2035
Table 63: Rest-of-Europe Automated Data Logging Tools and Systems Market (by Application), $Million, 2024-2035
Table 64: Rest-of-Europe Automated Data Logging Tools and Systems Market (by Application), Units, 2024-2035
Table 65: Rest-of-Europe Automated Data Logging Tools and Systems Market (by Hardware), $Million, 2024-2035
Table 66: Rest-of-Europe Automated Data Logging Tools and Systems Market (by Hardware), Units, 2024-2035
Table 67: Rest-of-Europe Automated Data Logging Tools and Systems Market (by Software), $Million, 2024-2035
Table 68: Asia-Pacific Automated Data Logging Tools and Systems Market (by Application), $Million, 2024-2035
Table 69: Asia-Pacific Automated Data Logging Tools and Systems Market (by Application), Units, 2024-2035
Table 70: Asia-Pacific Automated Data Logging Tools and Systems Market (by Hardware), $Million, 2024-2035
Table 71: Asia-Pacific Automated Data Logging Tools and Systems Market (by Hardware), Units, 2024-2035
Table 72: Asia-Pacific Automated Data Logging Tools and Systems Market (by Software), $Million, 2024-2035
Table 73: China Automated Data Logging Tools and Systems Market (by Application), $Million, 2024-2035
Table 74: China Automated Data Logging Tools and Systems Market (by Application), Units, 2024-2035
Table 75: China Automated Data Logging Tools and Systems Market (by Hardware), $Million, 2024-2035
Table 76: China Automated Data Logging Tools and Systems Market (by Hardware), Units, 2024-2035
Table 77: China Automated Data Logging Tools and Systems Market (by Software), $Million, 2024-2035
Table 78: Japan Automated Data Logging Tools and Systems Market (by Application), $Million, 2024-2035
Table 79: Japan Automated Data Logging Tools and Systems Market (by Application), Units, 2024-2035
Table 80: Japan Automated Data Logging Tools and Systems Market (by Hardware), $Million, 2024-2035
Table 81: Japan Automated Data Logging Tools and Systems Market (by Hardware), Units, 2024-2035
Table 82: Japan Automated Data Logging Tools and Systems Market (by Software), $Million, 2024-2035
Table 83: India Automated Data Logging Tools and Systems Market (by Application), $Million, 2024-2035
Table 84: India Automated Data Logging Tools and Systems Market (by Application), Units, 2024-2035
Table 85: India Automated Data Logging Tools and Systems Market (by Hardware), $Million, 2024-2035
Table 86: India Automated Data Logging Tools and Systems Market (by Hardware), Units, 2024-2035
Table 87: India Automated Data Logging Tools and Systems Market (by Software), $Million, 2024-2035
Table 88: South Korea Automated Data Logging Tools and Systems Market (by Application), $Million, 2024-2035
Table 89: South Korea Automated Data Logging Tools and Systems Market (by Application), Units, 2024-2035
Table 90: South Korea Automated Data Logging Tools and Systems Market (by Hardware), $Million, 2024-2035
Table 91: South Korea Automated Data Logging Tools and Systems Market (by Hardware), Units, 2024-2035
Table 92: South Korea Automated Data Logging Tools and Systems Market (by Software), $Million, 2024-2035
Table 93: Australia Automated Data Logging Tools and Systems Market (by Application), $Million, 2024-2035
Table 94: Australia Automated Data Logging Tools and Systems Market (by Application), Units, 2024-2035
Table 95: Australia Automated Data Logging Tools and Systems Market (by Hardware), $Million, 2024-2035
Table 96: Australia Automated Data Logging Tools and Systems Market (by Hardware), Units, 2024-2035
Table 97: Australia Automated Data Logging Tools and Systems Market (by Software), $Million, 2024-2035
Table 98: Rest-of-Asia-Pacific Automated Data Logging Tools and Systems Market (by Application), $Million, 2024-2035
Table 99: Rest-of-Asia-Pacific Automated Data Logging Tools and Systems Market (by Application), Units, 2024-2035
Table 100: Rest-of-Asia-Pacific Automated Data Logging Tools and Systems Market (by Hardware), $Million, 2024-2035
Table 101: Rest-of-Asia-Pacific Automated Data Logging Tools and Systems Market (by Hardware), Units, 2024-2035
Table 102: Rest-of-Asia-Pacific Automated Data Logging Tools and Systems Market (by Software), $Million, 2024-2035
Table 103: Rest-of-the-World Automated Data Logging Tools and Systems Market (by Application), $Million, 2024-2035
Table 104: Rest-of-the-World Automated Data Logging Tools and Systems Market (by Application), Units, 2024-2035
Table 105: Rest-of-the-World Automated Data Logging Tools and Systems Market (by Hardware), $Million, 2024-2035
Table 106: Rest-of-the-World Automated Data Logging Tools and Systems Market (by Hardware), Units, 2024-2035
Table 107: Rest-of-the-World Automated Data Logging Tools and Systems Market (by Software), $Million, 2024-2035
Table 108: South America Automated Data Logging Tools and Systems Market (by Application), $Million, 2024-2035
Table 109: South America Automated Data Logging Tools and Systems Market (by Application), Units, 2024-2035
Table 110: South America Automated Data Logging Tools and Systems Market (by Hardware), $Million, 2024-2035
Table 111: South America Automated Data Logging Tools and Systems Market (by Hardware), Units, 2024-2035
Table 112: South America Automated Data Logging Tools and Systems Market (by Software), $Million, 2024-2035
Table 113: Middle East and Africa Automated Data Logging Tools and Systems Market (by Application), $Million, 2024-2035
Table 114: Middle East and Africa Automated Data Logging Tools and Systems Market (by Application), Units, 2024-2035
Table 115: Middle East and Africa Automated Data Logging Tools and Systems Market (by Hardware), $Million, 2024-2035
Table 116: Middle East and Africa Automated Data Logging Tools and Systems Market (by Hardware), Units, 2024-2035
Table 117: Middle East and Africa Automated Data Logging Tools and Systems Market (by Software), $Million, 2024-2035
Table 118: Company Market Share, 2024
Figure 1: Automated Data Logging Tools and Systems Market (by Scenario), $Million, 2025, 2030, and 2035
Figure 2: Global Automated Data Logging Tools and Systems Market, 2024 and 2035
Figure 3: Key Countries, Global Automated Data Logging Tools and Systems Market, $Million, 2024
Figure 4: Global Market Snapshot, 2024
Figure 5: Global Automated Data Logging Tools and Systems Market, $Million, 2024 and 2035
Figure 6: Automated Data Logging Tools and Systems Market (by Application), $Million, 2024, 2030, and 2035
Figure 7: Automated Data Logging Tools and Systems Market (by Hardware), $Million, 2024, 2030, and 2035
Figure 8: Automated Data Logging Tools and Systems Market (by Software), $Million, 2024, 2030, and 2035
Figure 9: Automated Data Logging Tools and Systems Market Segmentation
Figure 10: Case Study - Pessl Instruments GmbH, Acclym Insights, and Davis Instruments, Inc.
Figure 11: Key Factors Accelerating Agricultural Data Logging Tools Adoption
Figure 12: Six Pillars of Technological Advancements in Automated Data Logging Tools and Systems
Figure 13: Patent Analysis (by Year and by Country), August 2021-August 2025
Figure 14: Patent Analysis (by Year and by Company), August 2021-August 2025
Figure 15: Global Automated Data Logging Tools and Systems Market (by Application), $Million, 2024, 2030, and 2035
Figure 16: Global Automated Data Logging Tools and Systems Market (by Application), Units, 2024, 2030, and 2035
Figure 17: Global Automated Data Logging Tools and Systems Market, Field Crop Monitoring, $Million, 2024-2035
Figure 18: Global Automated Data Logging Tools and Systems Market, Field Crop Monitoring, Units, 2024-2035
Figure 19: Global Automated Data Logging Tools and Systems Market, Irrigation and Fertigation Control System, $Million, 2024-2035
Figure 20: Global Automated Data Logging Tools and Systems Market, Irrigation and Fertigation Control System, Units, 2024-2035
Figure 21: Global Automated Data Logging Tools and Systems Market, Environmental Monitoring, $Million, 2024-2035
Figure 22: Global Automated Data Logging Tools and Systems Market, Environmental Monitoring, Units, 2024-2035
Figure 23: Global Automated Data Logging Tools and Systems Market, Others (Pest and Disease Risk Monitoring), $Million, 2024-2035
Figure 24: Global Automated Data Logging Tools and Systems Market, Others (Pest and Disease Risk Monitoring), Units, 2024-2035
Figure 25: Global Automated Data Logging Tools and Systems Market (by Hardware), $Million, 2024, 2030, and 2035
Figure 26: Global Automated Data Logging Tools and Systems Market (by Hardware), Units, 2024, 2030, and 2035
Figure 27: Global Automated Data Logging Tools and Systems Market (by Software), $Million, 2024, 2030, and 2035
Figure 28: Global Automated Data Logging Tools and Systems Market, Standalone Data Loggers, $Million, 2024-2035
Figure 29: Global Automated Data Logging Tools and Systems Market, Standalone Data Loggers, Units, 2024-2035
Figure 30: Global Automated Data Logging Tools and Systems Market, Multi-Sensor Logging Units, $Million, 2024-2035
Figure 31: Global Automated Data Logging Tools and Systems Market, Multi-Sensor Logging Units, Units, 2024-2035
Figure 32: Global Automated Data Logging Tools and Systems Market, Sensor + Telemetry Modules, $Million, 2024-2035
Figure 33: Global Automated Data Logging Tools and Systems Market, Sensor + Telemetry Modules, Units, 2024-2035
Figure 34: Global Automated Data Logging Tools and Systems Market, Automated Control Systems, $Million, 2024-2035
Figure 35: Global Automated Data Logging Tools and Systems Market, Automated Control Systems, Units, 2024-2035
Figure 36: Global Automated Data Logging Tools and Systems Market, IoT-Based Data Logging Platforms, $Million, 2024-2035
Figure 37: Global Automated Data Logging Tools and Systems Market, Decision Support and Analytics Platforms (AI/ML), $Million, 2024-2035
Figure 38: U.S. Automated Data Logging Tools and Systems Market, $Million, 2024-2035
Figure 39: Canada Automated Data Logging Tools and Systems Market, $Million, 2024-2035
Figure 40: Mexico Automated Data Logging Tools and Systems Market, $Million, 2024-2035
Figure 41: Germany Automated Data Logging Tools and Systems Market, $Million, 2024-2035
Figure 42: France Automated Data Logging Tools and Systems Market, $Million, 2024-2035
Figure 43: U.K. Automated Data Logging Tools and Systems Market, $Million, 2024-2035
Figure 44: Italy Automated Data Logging Tools and Systems Market, $Million, 2024-2035
Figure 45: Spain Automated Data Logging Tools and Systems Market, $Million, 2024-2035
Figure 46: Rest-of-Europe Automated Data Logging Tools and Systems Market, $Million, 2024-2035
Figure 47: China Automated Data Logging Tools and Systems Market, $Million, 2024-2035
Figure 48: Japan Automated Data Logging Tools and Systems Market, $Million, 2024-2035
Figure 49: India Automated Data Logging Tools and Systems Market, $Million, 2024-2035
Figure 50: South Korea Automated Data Logging Tools and Systems Market, $Million, 2024-2035
Figure 51: Australia Automated Data Logging Tools and Systems Market, $Million, 2024-2035
Figure 52: Rest-of-Asia-Pacific Automated Data Logging Tools and Systems Market, $Million, 2024-2035
Figure 53: South America Automated Data Logging Tools and Systems Market, $Million, 2024-2035
Figure 54: Middle East and Africa Automated Data Logging Tools and Systems Market, $Million, 2024-2035
Figure 55: Strategic Initiatives, January 2021-April 2025
Figure 56: Data Triangulation
Figure 57: Top-Down and Bottom-Up Approach
Figure 58: Assumptions and Limitations
Automated Data Logging Tools and Systems Market Report Coverage
Automated Data Logging Tools and Systems Market |
|||
Base Year |
2024 |
Market Size in 2024 |
$4,784.4 Million |
Forecast Period |
2025-2035 |
Value Projection and Estimation by 2035 |
$11,995.0 Million |
CAGR During Forecast Period |
8.65% |
Number of Pages |
177 |
Number of Tables |
118 | Number of Figures | 58 |
Key Market Players and Competition Synopsis
Automated data logging tools and systems for agriculture are technology-driven solutions designed to continuously capture and record critical farm parameters, including soil moisture, temperature, humidity, equipment performance, and weather conditions. By eliminating manual data entry and ensuring real-time monitoring, these systems empower farmers to make informed, timely decisions that optimize resource utilization, enhance productivity, and reduce operational risks. The market for automated data logging tools and systems is poised for substantial growth, driven by the integration of IoT, AI, and cloud-based analytics platforms that transform raw field data into actionable insights. These innovations enable predictive modeling for irrigation, fertilization, and crop health management, contributing to higher yields and more sustainable farming practices. Strong policy support for climate-smart agriculture, coupled with the rising global focus on efficient water and fertilizer use, is accelerating adoption across both large-scale and smallholder farms. As a result, automated data logging systems are becoming foundational to the digital transformation of agriculture, enabling compliance with sustainability standards and reducing environmental impact.
In March 2024, Campbell Scientific partnered with the International Crops Research Institute for the Semi-Arid Tropics (ICRISAT) to deploy solar-powered IoT-enabled data loggers across pilot farms in India and Africa. The project aims to provide farmers with real-time insights into soil moisture, rainfall, and nutrient conditions, thereby facilitating efficient irrigation scheduling and resource management. These loggers are also integrated with mobile applications, supporting smallholder farmers in regions with limited infrastructure and enabling them to adopt precision agriculture practices at scale. Such initiatives reflect a broader trend toward data-driven farming, where automation and digital tools bridge the gap between sustainability goals and practical farm management, ultimately enhancing resilience against climate variability and labor shortages.
Some prominent names established in this market are:
• Onset Computer Corporation (HOBO)
• Riot Technology Corporation (Gropoint)
• Gemini Data Loggers (TinyTag)
• Delta-T-Devices
• IRROMETER Company Inc.
• Sentek Technologies
• Lascar Electronics (Easylog)
• Campbell Scientific Inc.
• Munro Instruments Limited
• Spectrum Technologies Inc. (Watchdog)
• MicroEdge Instruments Inc.
• METER GROUP
• PCE INSTRUMENTS (PCE IBERICA)
• STEP Systems GmbH
• Thingslog
How can this report add value to an organization?
Product/Innovation Strategy: This report provides a detailed analysis of the automated data logging tools and systems market, segmented by application, hardware, software, and region. It covers various automated data logging tools and systems (hardware), such as standalone data loggers, multi-sensor logging units, sensor + telemetry modules, and automated control systems, and software such as IoT-based data logging platforms and decision support and analytics platforms (AI/ML) for several applications such as field crop monitoring, irrigation and fertigation control system, environmental monitoring, and others (pest and disease risk monitoring). The report helps innovators identify gaps in the current offering landscape and adapt product roadmaps to deliver differentiated, scalable, and regulatory-compliant solutions.
Growth/Marketing Strategy: The automated data logging tools and systems market has been rapidly evolving, with major players engaging in capacity expansion,strategic alliances, and pilot deployments to strengthen their market position. This report tracks those developments and provides insights into how key companies are entering or expanding into application segments. It supports marketing teams in identifying high-growth sectors, aligning value propositions with end-user expectations, and crafting targeted go-to-market strategies based on regional dynamics and technological readiness.
Competitive Strategy: A thorough competitive landscape is provided, profiling leading players based on their product offerings, innovation pipelines, partnerships, and expansion plans. Competitive benchmarking enables readers to evaluate how companies are positioned across product types and application areas.
Research Methodology
Data Sources
Primary Data Sources
The primary sources comprise industry experts from the automated data logging tools and systems market, as well as various stakeholders within the ecosystem. Respondents, including CEOs, vice presidents, marketing directors, and technology and innovation directors, have been interviewed to gather and verify both qualitative and quantitative aspects of this research study.
The key data points taken from primary sources include:
• validation and triangulation of all the numbers and graphs
• validation of report segmentations and key qualitative findings
• understanding the competitive landscape
• validation of the numbers in several categories
• percentage split of individual markets for geographical analysis
Secondary Data Sources
This research study utilizes extensive secondary research, including directories, company websites, and annual reports. It also utilizes databases, such as Hoover's, Bloomberg, Businessweek, and Factiva, to collect useful and effective information for an extensive, technical, market-oriented, and commercial study of the global market. In addition to core data sources, the study referenced insights from reputable organizations and websites, such as the Food and Agriculture Organization (FAO), United States Department of Agriculture (USDA), National Institute of Food and Agriculture (NIFA), Farm Bureau Federation (FBF), Canadian Agri-Food Automation and Intelligence Network (CAAIN), Smart Agriculture Council Mexico, Ministry of Agriculture, Food and Rural Affairs (MAFRA), Korea National Agricultural Cooperative Federation (NACF), Ministry of Agriculture and Rural Affairs (MARA), International Cooperative Agricultural Organization (ICAO), and others, to understand trends in the adoption of automated data logging tools and systems.
Secondary research has been done to obtain crucial information about the industry’s value chain, revenue models, the market’s monetary chain, the total pool of key players, and the current and potential use cases and applications.
The key data points taken from secondary research include:
• segmentations and percentage shares
• data for market value
• key industry trends of the top players in the market
• qualitative insights into various aspects of the market, key trends, and emerging areas of innovation
• quantitative data for mathematical and statistical calculations
Data Triangulation
This research study utilizes extensive secondary sources, including certified publications, articles by recognized authors, white papers, company annual reports, directories, and major databases, to collect useful and effective information for a comprehensive, technical, market-oriented, and commercial study of the automated data logging tools and systems market.
The process of market engineering involves the calculation of the market statistics, market size estimation, market forecast, market crackdown, and data triangulation (the methodology for such quantitative data processes has been explained in further sections). A primary research study has been undertaken to gather information and validate market numbers for segmentation types and industry trends among key players in the market.
Automated Data Logging Tools and Systems Market Overview
Introduction of the Automated Data Logging Tools and Systems Market
The automated data logging tools and systems market represents a critical pillar of modern precision agriculture, enabling farmers to collect, store, and analyze real-time information about their fields, crops, and equipment. These systems utilize sensors, IoT devices, and cloud connectivity to capture essential parameters, including soil moisture, nutrient levels, temperature, humidity, and machinery performance, which are then automatically recorded and transmitted to centralized platforms. By replacing manual record-keeping with automated, error-free processes, these solutions empower farmers to make data-driven decisions that optimize crop yields, reduce input costs, and enhance sustainability.
The growing emphasis on smart farming and digital transformation in agriculture has positioned automated data logging systems as indispensable tools for farm management. They serve as the backbone of predictive analytics, enabling timely interventions for irrigation, fertilization, and pest control while ensuring compliance with environmental regulations and sustainability standards. With the integration of advanced technologies such as AI, ML, and cloud computing, data logging systems are evolving from simple monitoring devices to decision-support systems that provide actionable insights at the farm level. Notably, by 2025, 65% of agricultural companies are estimated to have adopted cloud computing for data management, and the deployment of IoT sensors in farming soared 35% between 2018 and 2022. This widespread digitization highlights the increasing reliance on automated data systems as a central component of farm management.
Market Overview
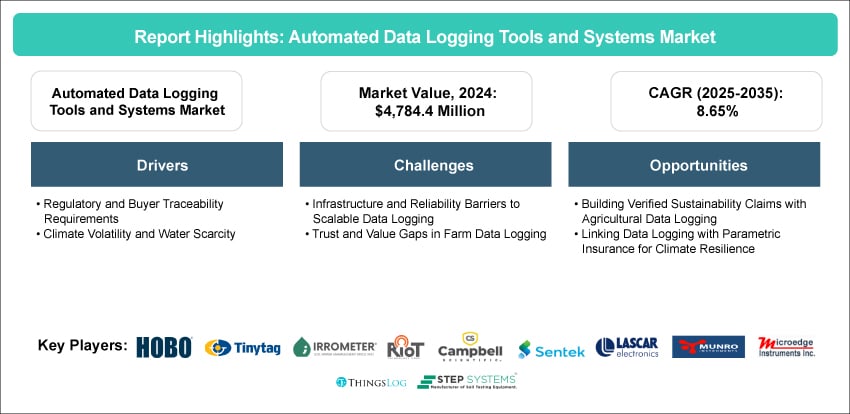
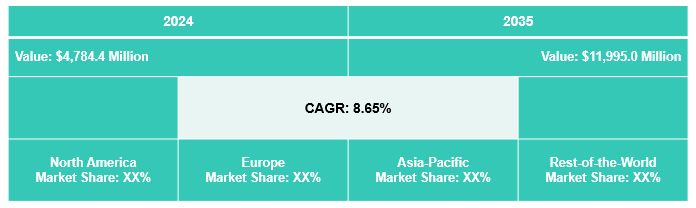
The automated data logging tools and systems market’s revenue was $4,784.4 million in 2024, and it is expected to reach $11,995.0 million by 2035, advancing at a CAGR of 8.65% during the forecast period (2025-2035). The automated data logging tools and systems market is growing rapidly due to rising global food demand, increasing pressure on farmers to improve productivity, and the accelerating adoption of digital technologies, including IoT, AI, and cloud platforms, in agriculture. These systems provide real-time, accurate insights into soil, crop, and weather conditions, enabling the optimization of resources, informed decision-making, and compliance with sustainability standards. Strong government incentives for climate-smart farming, combined with growing concerns over water use, fertilizer efficiency, and carbon emissions, are further boosting adoption. Additionally, labor shortages and the rising availability of affordable, solar-powered, and mobile-enabled loggers are making the technology accessible to smallholder farmers, ensuring widespread adoption across both developed and emerging markets.
Market Snapshot
Industrial Impact
The adoption of automated data logging tools and systems is reshaping the agricultural industry by driving a fundamental shift toward data-driven, precision-based operations. For farm equipment manufacturers, this creates new opportunities to integrate smart sensors, connectivity, and cloud platforms into their product portfolios, thereby strengthening after-sales services and generating recurring revenue streams through data subscriptions. Agrochemical and seed companies are leveraging these systems to provide tailored crop management solutions, linking product usage with real-time field conditions to maximize efficiency and sustainability. For irrigation and water management firms, data loggers support advanced solutions for optimizing water use, aligning with global sustainability goals. Importantly, these systems are reducing farmers’ dependence on manual labor, improving compliance with regulatory requirements, and enhancing supply chain transparency by enabling traceable production practices. Collectively, this industrial shift is fostering collaboration between agriculture, technology, and sustainability-focused sectors, accelerating the transformation of farming into a digitally integrated, climate-resilient industry.
Market Segmentation
Segmentation 1: By Application
• Field Crop Monitoring
• Irrigation and Fertigation Control System
• Environmental Monitoring
• Others (Pest and Disease Risk Monitoring)
Irrigation and Fertigation Control System to Lead the Market (by Application)
Irrigation and fertigation control systems are expected to lead the automated data logging tools and systems market by application, as they directly address two of the most critical challenges in agriculture, efficient water management and optimized nutrient delivery. With growing concerns over water scarcity, rising input costs, and stricter sustainability regulations, farmers are increasingly adopting smart data loggers that monitor soil moisture, weather patterns, and crop nutrient needs in real time to precisely control irrigation and fertigation schedules. These systems not only minimize wastage of water and fertilizers but also enhance crop yields and quality, making them highly cost-effective and environmentally sustainable. As a result, irrigation and fertigation control systems are emerging as the largest and fastest-growing application area, driving significant adoption across both developed and emerging agricultural markets.
Segmentation 2: By Hardware
• Standalone Data Loggers
• Multi-Sensor Logging Units
• Sensor + Telemetry Modules
• Automated Control Systems
Multi-Sensor Logging Units to Dominate the Market (by Hardware)
Multi-sensor logging units are set to dominate the automated data logging tools and systems market by hardware, as they offer comprehensive monitoring capabilities by integrating multiple sensors, such as those for soil moisture, temperature, humidity, nutrient levels, and weather conditions, into a single platform. This multi-parameter approach provides farmers with a holistic view of field conditions, enabling more accurate and timely decision-making compared to single-sensor devices. Their ability to collect diverse data streams simultaneously not only enhances efficiency but also supports advanced applications, such as precision irrigation, fertigation, and crop health monitoring. As farming becomes increasingly data-driven, the demand for versatile, integrated solutions is surging, positioning multi-sensor logging units as the preferred choice for both large-scale agribusinesses and smallholder farmers looking to maximize productivity and sustainability.
Segmentation 3: By Software
• IoT-Based Data Logging Platforms
• Decision Support and Analytics Platforms (AI/ML)
IoT-Based Data Logging Platforms to Dominate the Market (by Software)
IoT-based data logging platforms are projected to dominate the market by software, as they serve as the backbone of connected agriculture by enabling seamless integration of sensors, devices, and farm management systems. These platforms collect and transmit real-time data from the field to cloud-based dashboards, where advanced analytics and AI-driven insights help farmers optimize irrigation, fertigation, pest control, and overall crop management. Their scalability, remote accessibility through smartphones and tablets, and ability to support predictive decision-making make them far more valuable than traditional standalone software. Moreover, the growing adoption of smart farming practices and government-backed digital agriculture initiatives is accelerating the deployment of IoT-enabled platforms, cementing their position as the most critical software segment in the automated data logging tools and systems market.
Segmentation 4: By Region
• North America
• Europe
• Asia-Pacific
• Rest-of-the-World
North America to Lead the Market (by Region)
North America is expected to lead the automated data logging tools and systems market by region, driven by its highly mechanized agricultural sector, strong digital infrastructure, and widespread adoption of precision farming practices. The presence of major agri-tech companies, coupled with significant investments in IoT, AI, and cloud-based farming solutions, has accelerated the integration of advanced data logging systems across large-scale farms. Government support for sustainable agriculture, water conservation, and climate-smart initiatives further boosts adoption, while rising labor costs and the need for higher productivity reinforce the shift toward automation. With its combination of technological maturity, supportive policies, and early adopter farmers, North America continues to set the pace for innovation and deployment in this market, positioning the region at the forefront of global growth.
Recent Developments in the Automated Data Logging Tools and Systems Market
• In 2024, Onset Computer Corporation launched the HOBO MX20L Water Level wireless logger.
• In 2023, Onset Computer Corporation launched the Remote Water Level Monitoring System for wells/groundwater.
• In 2022, Gemini Data Loggers launched Tinytag DI (21 CFR Part 11) software for audit-trail data integrity, useful for regulated agrifood environments.
• In 2023, Delta T Devices partnered with SAF Tehnika’s Aranet wireless platform for commercial horticulture (sensor-to-cloud).
Analyst’s Thoughts
According to Dhrubajyoti, Principal Analyst at BIS Research, “The automated data logging tools and systems market is evolving as a cornerstone of digital agriculture, with strong growth momentum fueled by the convergence of IoT, AI, and cloud technologies. Analysts view the market as entering a critical inflection point where data-driven farming is no longer optional but essential to address global challenges such as food security, climate variability, and resource scarcity. The increasing affordability of multi-sensor and mobile-enabled loggers, coupled with government support for climate-smart practices, is accelerating adoption across both developed and emerging economies. However, while the long-term outlook remains highly positive, analysts caution that issues such as data privacy, interoperability between platforms, and limited digital infrastructure in rural regions could temporarily slow growth. Overall, automated data logging systems are expected to become the backbone of precision agriculture, driving productivity gains and sustainability outcomes across the global farming ecosystem.”
Automated Data Logging Tools and Systems Market - A Global and Regional Analysis
Focus on Application, Product, and Regional Analysis - Analysis and Forecast, 2025-2035
Frequently Asked Questions
Automated data logging tools and systems are technology-driven devices and platforms designed to continuously collect, record, and store data from agricultural environments without the need for manual intervention. They integrate sensors, microcontrollers, wireless connectivity (IoT), and cloud software to monitor critical farm parameters such as soil moisture, temperature, humidity, nutrient levels, weather conditions, irrigation flow, and even equipment performance. The types of automated data logging tools and systems available in the market are standalone data loggers, multi-sensor logging units, sensor + telemetry modules, and automated control systems.
Companies in the automated data logging tools and systems market have been focusing on offering advanced solutions and investing in their development. Companies operating in the automated data logging tools and systems market are employing a combination of product launches, technology innovation, ecosystem integration, and strategic partnerships to strengthen their competitive position.
A new company entering the automated data logging tools and systems market should focus on delivering affordable, scalable, and user-friendly solutions that cater to both smallholder and large-scale farmers, while leveraging IoT, AI, and cloud technologies to provide actionable insights rather than just raw data. Emphasis should be placed on interoperability with existing farm equipment, mobile-first platforms for ease of access, and niche applications such as high-value crops and greenhouse farming, where precision monitoring yields the greatest impact. Building features that support sustainability reporting and compliance with climate-smart agriculture initiatives will enhance relevance. Meanwhile, providing strong customer education, training, and partnerships with agri-institutes or cooperatives will help drive adoption and trust. This combination of affordability, intelligence, and adaptability will be key to staying competitive in a market dominated by larger established players.
The automated data logging tools and systems market was valued at $4,784.4 million in 2024 and is expected to grow at a CAGR of 8.65%, reaching $11,995.0 million by 2035.
Major trends in the automated data logging tools and systems market include the integration of artificial intelligence and machine learning for predictive data analytics, as well as edge and next-generation networks, driving real-time control. Drivers include the regulatory and buyer traceability requirements, climate volatility, and water scarcity.
Despite its promise, the automated data logging tools and systems market faces several challenges. These include infrastructure and reliability barriers to scalable data logging, as well as trust and value gaps in farm data logging.
The automated data logging tools and systems market presents strong growth opportunities, particularly in regions seeking affordable and scalable agritech solutions. Major opportunities in the market include building verified sustainability claims through the use of agricultural data logging.
The report’s unique selling propositions (USPs) lie in its comprehensive segmentation of the automated data logging tools and systems market by application, hardware, software, and region. It offers a thorough analysis of key trends, market drivers, and challenges across major countries, including the U.S., China, India, Germany, France, and the U.K., along with country-level forecasts and policy insights. The study also features detailed profiles of leading automated data logging tools and systems companies, as well as emerging startups, supported by expert analysis that highlights innovation hubs and untapped revenue opportunities. Additionally, it provides strategic guidance to help organizations enhance their competitive positioning and navigate the evolving market landscape.
Agricultural equipment manufacturers, agribusinesses and farmers, precision ag technology providers, government entities and policymakers, financial institutions and investors, agricultural consultants and advisory services, and R&D institutions should consider this report. It is particularly valuable for stakeholders seeking to understand the evolving landscape of the automated data logging tools and systems market, identify growth opportunities, and explore strategic partnerships and areas for technology investment.