
Published Year: 2024
Automotive Sensors Market - A Global and Regional Analysis: Focus on Application, Vehicle Type, Sens
The global automotive sensors market was valued at $26.06 billion in 2023, and it is expected...
Focus on Vehicle Type, Power Source, Sensor Type, Point of Sale, and Country-Level Analysis - Analysis and Forecast, 2023-2033
Delivery Time: 1-5 Working Days
Get ISO Certified Research, Customization, Data Extraction, and Value-Added Services with All BIS Research Reports
BIS Research provides a comprehensive report library with unlimited access to data, insights, and market intelligence through Subscription.
Get Subscription Know More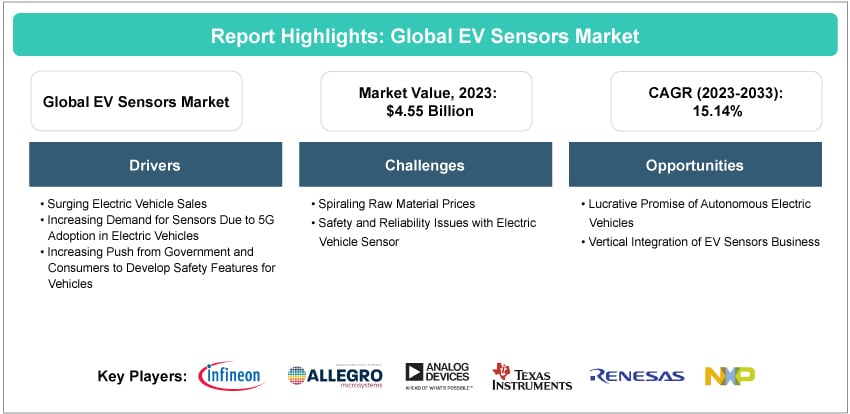
The electric vehicle sensors market was valued at $4.55 billion in 2023, and it is expected to grow at a CAGR of 15.14% and reach $18.64 billion by 2033. This market is shaped by the increasing adoption of electric vehicles and the growing demand for autonomous vehicles. Conversely, challenges such as regulatory discrepancies, global uncertainties, economic instability, and infrastructural limitations pose hurdles to growth.
Introduction of EV Sensors
Electric Vehicles (EVs) leverage a complex sensor network to deliver operational efficiency, advanced safety, and market-differentiating features. This sensor technology is pivotal for intelligent battery management, optimizing range and longevity through real-time monitoring. Moreover, sensors protect critical EV components such as motors and inverters, ensuring both performance and long-term asset value.
The integration of ADAS, empowered by sensors such as LiDAR and radar, unlocks a new level of safety while laying the groundwork for autonomous capabilities. The EV market's exponential growth underscores the necessity for continued investment in sensor technologies, which will drive enhanced efficiency, reliability, and consumer-centric innovation.
Market Introduction
The electric vehicle sensors market is undergoing remarkable expansion, fueled by the swift uptake of electric vehicles on a global scale. Sensors play a crucial role in ensuring the functionality and safety of EVs, meticulously overseeing battery performance powertrain components, and facilitating advanced driver assistance systems (ADAS) that are revolutionizing the driving experience. The increasing demand for extended driving range, enhanced safety measures, and the evolution toward autonomous driving technologies are driving innovation and capital investment in EV sensor technology. Projections for the market anticipate sustained growth as sensor capabilities continue to advance, thereby optimizing EV efficiency and reliability, and enhancing user-centric features.
Industrial Impact
Given the increasing demand for electric vehicles and the growing market for advanced automotive electronics, the demand for EV sensors is expected to continue to rise. However, concerns about semiconductor shortage, the Russia-Ukraine war, and the need for sustainable materials for manufacturing sensors are prompting research and development efforts aimed at improving the efficiency and environmental performance of EV sensor production processes, as well as exploring alternative sources of materials for its manufacture.
The key players operating in the electric vehicle sensors market include Allegro MicroSystems, Inc., Amphenol Advanced Sensors, ams Osram AG, Analog Devices, Inc., Denso Corporation, Infineon Technologies AG, Kohshin Electric Corporation, LEM, Zebra Technologies, Inc., NXP Semiconductors, Renesas Electronics Corporation, Melexis. STMicroelectronics, Vishay Intertechnology, Inc., Texas Instruments Incorporated, and among others. These companies are focusing on strategic partnerships and product launches to expand their market presence.
Market Segmentation:
Segmentation 1: by Vehicle Type
• Passenger Vehicles
• Commercial Vehicles
Passenger Vehicles to Dominate the Electric Vehicle Sensors Market (by Vehicle Type)
As the global electric vehicle sensors market shifts toward sustainability, the demand for passenger vehicles is expected to surge. This is largely due to sensors' critical role in bolstering vehicle safety and performance. A significant increase in consumer preference for safety-first vehicles has strengthened the necessity for sensors in electric cars. Furthermore, consumers' growing affluence is driving the demand for electric vehicles that boast advanced features and superior safety measures, propelling the growth of passenger vehicles in the market. Additionally, continuous advancements in sensor technology are boosting the driving experience, contributing to the electric vehicle industry's robust and sustainable growth by making cars more reliable, efficient, and user-friendly.
Segmentation 2: by Power Source
• Battery Electric Vehicles (BEVs)
• Hybrid Electric Vehicles (HEVs)
• Plug-In Hybrid Electric Vehicles (PHEVs)
Battery Electric Vehicles to Dominate in the Electric Vehicle Sensors Market (by Power Source)
Battery electric vehicles (BEVs) are set to dominate the electric vehicle sensors market, a trend driven by their reliance on electric powertrains. This reliance necessitates a comprehensive range of sensors to ensure the battery's health, temperature, and energy efficiency are constantly monitored and managed. Unlike hybrid systems, BEVs' simplicity in technology means there's less mechanical complexity but a greater need for precise and dependable sensor data to maintain optimal performance and safety. With sustainability becoming a key consumer priority, the demand for BEVs is experiencing a surge, which is propelling advancements in sensor technology. These advancements are crucial for improving vehicle diagnostics, performance, and user experience. A key example of this dynamic is the evolution of battery management systems (BMS), essential for BEVs. BMSs are bolstering their reliance on sensors to execute vital tasks, including the monitoring of cell voltage and temperature, thereby boosting the growth of robust sensor technologies in the automotive sector.
Segmentation 3: by Sensor Type
• Temperature Sensors
• Current/Voltage Sensors
• Pressure Sensors
• Position Sensors
Current/Voltage Sensors to Dominate in the Electric Vehicle Sensors Market (by Sensors Type)
Current/voltage sensors are leading the electric vehicle sensors market due to their crucial function in maintaining efficient and safe operations of electric vehicles (EVs). These sensors are instrumental in overseeing the electrical system's integrity, enabling the battery management system to accurately determine the battery's state of charge and health. Such detailed monitoring is vital for enhancing the vehicle's range, performance, and durability. Specifically, for battery electric vehicles (BEVs), these sensors provide real-time insights into an electrical flow, boosting the capability to promptly identify any anomalies that might suggest problems, such as battery wear or short circuits. This role is propelling the growth of the EV sensors market, bolstering the technology's adoption due to its robust contribution to vehicle reliability and longevity.
Segmentation 4: by Point of Sale
• OEM
• Aftermarket
OEM to be Dominant in the Electric Vehicle Sensors Market (by Point of Sale)
The dominance of original equipment manufacturers (OEMs) in the electric vehicle sensors market is expected to surge, primarily driven by their critical involvement in the early stages of sensor integration into EVs. This position enables OEMs to ensure that these essential components match the vehicle's precise needs and specifications flawlessly. By controlling the design and manufacturing processes, OEMs can seamlessly embed advanced sensor technologies into the vehicle’s framework. This integration not only boosts the vehicle’s performance but also strengthens its safety features from the start, propelling robust growth in the electric vehicle sensors market.
Segmentation 5: by Region
• North America: U.S., Canada, and Mexico
• Europe: Germany, France, Italy, U.K., Netherlands, and Rest-of-Europe
• Asia-Pacific: China, Japan, Australia, South Korea, India, and Rest-of-Asia-Pacific
• Rest-of-the-World: Brazil, U.A.E., Others
The electric vehicle sensors market is experiencing considerable growth in the Asia-Pacific region, propelled by the accelerated adoption of electric vehicles in economically advanced nations such as China, Japan, and South Korea. The International Energy Agency (IEA) reports that, for FY2022, China was responsible for approximately 60% of all new global car registrations, underlining its significant contribution to the sector's expansion. Additionally, the Asia-Pacific area serves as a hub for numerous EV manufacturers such as BYD, SAIC, Nio, Nissan, Hyundai, and Toyota, further boosting the market's dynamics.
Countries on the rise, including India and Malaysia, are also demonstrating considerable strides in the electric vehicle sensors market, backed by robust government initiatives to foster the use of renewable energy. This surge is bolstering the sector's overall growth, indicating a positive trajectory for the adoption of sustainable transportation solutions.
Recent Developments in the Electric Vehicle Sensors Market
• In August 2023, Allegro MicroSystems, Inc., renowned for its pioneering power and sensing semiconductor technology in motion control and energy-efficient systems, strengthened its market position by securing a definitive agreement to acquire Crocus Technology.
• In February 2024, Infineon and Honda forged a strategic partnership for next-generation automotive technologies. MoU positions Infineon as a key semiconductor supplier in Honda's future roadmap.
• In January 2023, NXP and VinFast teamed up to deliver integrated, future-ready EV solutions, underlining the focus on providing comprehensive technology suites.
Demand - Driver, Limitation, and Opportunity
Market Demand Driver: Increasing Push from Government and Consumers to Develop Safety Features for Vehicles
Innovative sensor technologies are rapidly transforming vehicle design, driven by safety demands. Automakers are strategically integrating sensors to improve safety systems and reduce road accidents. Key players such as Allegro MicroSystems, Elmos Semiconductor SE, Infineon Technologies AG, and NXP Semiconductors are leading this innovation, developing sensors that optimize EV safety by accurately monitoring steering and braking. The growing popularity of advanced driver-assistance systems (ADAS) further fuels the need for sophisticated sensors to ensure safety and comfort. Sensor technology is constantly evolving, leading to improved vehicle performance and reliability. ADAS systems are at the forefront of tackling safety concerns, using advanced technologies such as embedded vision, connectivity, and intuitive human-machine interfaces. The concerning rate of vehicle accidents highlights the urgency for the widespread adoption of these safety-focused advancements.
Market Challenge: Spiraling Raw Material Prices
The electric vehicle sensors market faces increasing pressure due to the rising costs of essential raw materials. Manufacturers grapple with skyrocketing prices for metals, rare earths, and semiconductors, directly impacting production costs. Semiconductor shortages, supply chain issues, and global instability further worsen this price volatility. This could slow down innovation in EV sensor technology and hinder adoption. As input costs soar, manufacturers struggle to maintain profit margins, potentially leading to higher consumer prices. The unpredictable raw materials market adds risk to production planning, potentially stalling the growth of the EV sensor sector. To stay competitive, manufacturers must find alternative supply sources or invest in research on new materials.
Market Opportunity: Lucrative Promise of Autonomous Electric Vehicles
The rise of safety features and advanced vehicle control in electric vehicles (EVs) is pushing development costs higher. This is especially true for autonomous and semi-autonomous vehicles, which need many different sensors. As EVs with self-driving features become the norm, this sensor-heavy approach will boost demand for these components. Manufacturers must navigate this complex market carefully, investing in top-notch sensors and advanced control systems to succeed. These upgrades improve safety and user experience, plus they add innovative features that will appeal to customers. The need to monitor and test these systems throughout a vehicle's life brings more revenue potential for sensor makers and service providers. Ultimately, increased sensor use points to strong growth in the electric vehicle sensor market. Manufacturers ready with reliable, affordable, and cutting-edge sensor solutions will be best positioned to capitalize on this expanding opportunity where safety, automation, and electrification reshape the future of transportation.
Analyst View
According to Debraj Chakraborty, Principal Analyst, BIS Research, “Demand for advanced automotive electronics, increase in number of sensors per vehicle, and growing adoption of connected electric vehicles is expected to boost electric vehicle sensor sales in the forecast period. Rising awareness about electric vehicle benefits and government support for pushing electric vehicle sales led to significant demand for electric vehicle sensors. Strategic partnerships and collaborations between electric vehicle sensors and electric vehicle manufacturers to develop advanced and robust sensors are further strengthening the global electric vehicle sensors market.”
Focus on Vehicle Type, Power Source, Sensor Type, Point of Sale, and Country-Level Analysis - Analysis and Forecast, 2023-2033
Ans: The increasing push from the government and consumers to develop safety features for vehicles, the increasing demand for sensors due to 5G adoption in electric vehicles, and the growth in electric vehicle sales are some of the main drivers that are propelling the growth of the electric vehicle sensors market.
Ans: The supply chain in the electric vehicle sensors market operates through a network of raw material and component suppliers, manufacturers, distributors, and dealers that ensure the availability of EV sensors across various segments. The demand for EV sensors is mainly driven by electric vehicle sales.
Ans: Existing market players are focusing on expanding their sales and distribution networks, improving efficiency, and forming partnerships and collaborations to strengthen their market position.
Ans: The following can be termed as some of the USPs of the report:
• Extensive competitive benchmarking of 15 key players to offer a holistic view of the EV Sensors Market landscape
• Investment landscape, including product adoption scenario, funding, and patent analysis
Ans: The companies that produce EV sensors, component suppliers, distributors, electric vehicle manufacturers, research institutions, and regulatory bodies involved in the electric vehicle sensors market should buy this report.
The global automotive sensors market was valued at $26.06 billion in 2023, and it is expected...
The EV fast-charging system market was valued at $8.39 billion in 2023 and is expected to...