Published Year: 2018
Global Precision Agriculture Market - Analysis and Forecast, 2018-2025: Focus on Solution (Hardware
The precision agriculture market is projected to grow from $4.29 billion in the year 2018 to...
Focus on Delivery Model (On-Cloud and On-Premise), Application (Precision Crop Farming, Livestock Monitoring, and Indoor Farming and Aquaculture), and Country
Delivery Time: 1-5 Working Days
Get ISO Certified Research, Customization, Data Extraction, and Value-Added Services with All BIS Research Reports
BIS Research provides a comprehensive report library with unlimited access to data, insights, and market intelligence through Subscription.
Get Subscription Know More
1.1 Drivers
1.1.1 Convenience of Cloud Usage
1.1.2 Government Initiatives to Improve Farming and Agriculture
1.1.3 Cost-Effective Farming
1.1.4 Increasing Farm Size
1.2 Restraints
1.2.1 Lack of Technical Knowledge among Farmers
1.2.2 Risk of Security Breaches
1.3 Opportunities
1.3.1 Data Management with Big Data
1.3.2 Increased Availability of Portable Devices
1.3.3 Abundance of Arable Land
2.1 Key Market Developments and Strategies
2.1.1 New Product Launches and Development
2.1.2 Partnerships, Collaborations, and Joint Ventures
2.1.3 Mergers and Acquisitions
2.1.4 Business Expansion and Contracts
2.1.5 Others (Awards and Recognitions)
2.2 Market Share Analysis
2.2.1 Germany Crop Farm Management Software and Service Market Share Analysis
2.2.2 U.K. Crop Farm Management Software and Service Market Share Analysis
2.2.3 France Crop Farm Management Software and Service Market Share Analysis
2.2.4 Italy Crop Farm Management Software and Service Market Share Analysis
2.2.5 Netherlands Crop Farm Management Software and Service Market Share Analysis
2.2.6 Spain Crop Farm Management Software and Service Market Share Analysis
2.2.7 Russia Crop Farm Management Software and Service Market Share Analysis
2.2.8 Ukraine Crop Farm Management Software and Service Market Share Analysis
2.2.9 Poland Crop Farm Management Software and Service Market Share Analysis
2.2.10 Austria Crop Farm Management Software and Service Market Share Analysis
2.2.11 Czech Republic Crop Farm Management Software and Service Market Share Analysis
3.1 Industry Attractiveness
3.1.1 Threat of New Entrants
3.1.2 Bargaining Power of Buyers
3.1.3 Bargaining Power of Suppliers
3.1.4 Threat from Substitutes
3.1.5 Intensity of Competitive Rivalry
3.2 Key Venture Capital Investments
4.1 Assumptions and Limitations for Analysis and Forecast of the Europe Farm Management Software and Services Market
4.2 Market Overview
4.3 On-Cloud Delivery Model
4.4 On-Premise Delivery Model
5.1 Precision Crop Farming
5.1.1 Yield Monitoring and Farm Mapping
5.1.2 Crop Scouting
5.1.3 Weather Tracking and Forecasting
5.1.4 Irrigation Management
5.1.5 Farm Economics
5.1.6 Other Applications of Precision Crop Farming Application Area
5.2 Livestock Monitoring and Management
5.2.1 Milk Harvesting
5.2.2 Animal Health Monitoring and Comfort
5.2.3 Feeding Management
5.2.4 Heat Stress and Fertility Monitoring
5.2.5 Other Applications of Livestock Monitoring and Management Application Area
5.3 Indoor Farming
5.3.1 Climate Control Management
5.3.2 Lighting Management
5.3.3 Plant Development Monitoring
5.3.4 Other Applications of Indoor Farming Application Area
5.4 Aquaculture
5.4.1 Feed Management
5.4.2 Aquatic Species Tracking and Navigation
5.4.3 Water Quality Management
5.4.4 Other Applications of Aquaculture Application
5.5 Others
6.1.1 Germany
6.1.2 The U.K
6.1.3 France
6.1.4 Italy
6.1.5 The Netherlands
6.1.6 Spain
6.1.7 Russia
6.1.8 Ukraine
6.1.9 Poland
6.1.10 Austria
6.1.11 Czech Republic
6.1.12 Rest-of-Europe
Overview
Precision Crop Farming
7.1 365FarmNet GmbH
7.1.1 Company Overview
7.1.2 Product Portfolio
7.1.3 Corporate Summary
7.1.4 SWOT Analysis
7.2 Agrivi
7.2.1 Company Overview
7.2.2 Product Portfolio
7.2.3 Corporate Summary
7.2.4 SWOT Analysis
7.3 Agroptima S.L.
7.3.1 Company Overview
7.3.2 Product Portfolio
7.3.3 Corporate Summary
7.3.4 SWOT Analysis
7.4 Deere & Company
7.4.1 Company Overview
7.4.2 Product Portfolio
7.4.3 Financials
7.4.3.1 Financial Summary
7.4.4 SWOT Analysis
7.5 Hexagon Agriculture
7.5.1 Company Overview
7.5.2 Product Portfolio
7.5.3 Corporate Summary
7.5.4 SWOT Analysis
7.6 Topcon Positioning Systems
7.6.1 Company Overview
7.6.2 Product Portfolio
7.6.3 Corporate Summary
7.6.4 SWOT Analysis
7.7 Trimble Inc.
7.7.1 Company Overview
7.7.2 Product Portfolio
7.7.3 Financials
7.7.3.1 Financial Summary
7.7.4 SWOT Analysis
Livestock Monitoring and Management
7.8 DeLaval
7.8.1 Company Overview
7.8.2 Product Portfolio
7.8.3 Corporate Summary
7.8.4 SWOT Analysis
7.9 Fullwood Ltd.
7.9.1 Company Overview
7.9.2 Product Portfolio
7.9.3 Corporate Summary
7.9.4 SWOT Analysis
7.10 GEA Group
7.10.1 Company Overview
7.10.2 Product Portfolio
7.10.3 Financials
7.10.4 SWOT Analysis
7.11 Lely S.a.r.l
7.11.1 Company Overview
7.11.2 Product Portfolio
7.11.3 Corporate Summary
7.11.4 SWOT Analysis
Indoor Farming
7.12 MotorLeaf Inc.
7.12.1 Company Overview
7.12.2 Product Portfolio
7.12.3 Corporate Summary
7.12.4 SWOT Analysis
7.13 Infarm - Indoor Urban Farming Gmbh
7.13.1 Company Overview
7.14 Lettus Grow Ltd.
7.14.1 Company Overview
Aquaculture
7.15 AKVA Group ASA
7.15.1 Company Overview
7.15.2 Product Portfolio
7.15.3 Financials
7.15.3.1 Financial Summary
7.15.4 SWOT Analysis
7.16 Integrated Information Systems S.A.
7.16.1 Company Overview
8.1 Report Scope
8.2 Europe Farm Management Software and Services Market Research Methodology
8.2.1 Assumptions and Limitations
8.2.2 Primary Data Sources
8.2.3 Secondary Data Sources
8.2.4 Data Triangulation
8.2.5 Data Analysing and Market Estimation
Table 1.1 Initiatives by Governments of Various Countries to Promote Farming
Table 2.1 Key Product Launches, June 2015-June 2018
Table 2.2 Key Partnerships, Collaborations, and Joint Ventures, June 2015-June 2018
Table 2.3 Key Mergers and Acquisitions, June 2015-June 2018
Table 2.4 Key Business Expansion Activities, June 2015-June 2018
Table 2.5 Other Key Strategic Developments, June 2015-June 2018
Table 3.1 Analyzing the Threat of New Entrants
Table 3.2 Analyzing the Bargaining Power of Buyers
Table 3.3 Analyzing the Bargaining Power of Suppliers
Table 3.4 Analyzing the Threat from Substitutes
Table 3.5 Analyzing the Intensity of Competitive Rivalry
Table 4.1 Europe Farm Management Software and Services Market (by Delivery Model), 2017-2023
Table 5.1 Europe Farm Management Software and Services Market (by Application), 2017-2023
Table 5.2 Precision Crop Farming in Europe Farm Management Software and Services Market (by Type), $Million, 2017-2023
Table 5.3 Yield Monitoring and Farm Mapping Products by Leading Companies
Table 5.4 Crop Scouting Products by Leading Companies
Table 5.5 Weather Tracking and Forecasting Products by Leading Companies
Table 5.6 Farm Economics Products by Leading Companies
Table 5.7 Inventory Management and Applicator Solutions by Leading Companies
Table 5.8 Livestock Monitoring and Management in Europe Farm Management Software and Services Market, $Million, 2017-2023
Table 5.9 Animal Health Monitoring and Comfort Software and Services by Key Companies
Table 5.10 Indoor Farming in Europe Farm Management Software and Services Market, $Million, 2017-2023
Table 5.11 Plant Development Monitoring Solutions by Key Companies
Table 5.12 Aquaculture in Europe Farm Management Software and Services Market, $Million, 2017-2023
Table 5.13 Feed Management Solutions by Key Companies
Table 5.14 Aquatic Species Tracking and Navigation Solutions by Key Companies
Table 5.15 Water Quality Management Solutions by Key Companies
Table 5.16 Other Aquaculture Solutions by Key Companies
Table 5.17 Products in Other Application Areas in Farm Management Software and Services Market
Table 6.1 Europe Farm Management Software and Services Market (by Country), $Million, 2017-2023
Table 6.2 Total Agricultural Farms and Utilised Agricultural Area in Germany (by Farm Size), 2016
Table 6.3 Germany Farm Management Software and Services Market (by Application), $Million, 2017-2023
Table 6.4 Germany Farm Management Software and Services Market (by Key Crop Type), $Million, 2017-2023
Table 6.5 Farm Management Software by Key Companies in Germany
Table 6.6 Strategic Developments by Key Farm Management Software and Service Providers in Germany, June 2015-June 2018
Table 6.7 The U.K. Farm Management Software and Services Market (by Application), $Million, 2017-2023
Table 6.8 The U.K. Farm Management Software and Services Market (by Key Crop Type, By Value), $Million, 2017-2023
Table 6.9 Farm Management Software by Key Companies in the U.K.
Table 6.10 Strategic Developments by Key Farm Management Software and Service Providers in the U.K., June 2015-June 2018
Table 6.11 France Farm Management Software and Services Market (by Application), $Million, 2017-2023
Table 6.12 France Farm Management Software and services Market (by Key Crop Type), $Million, 2017-2023
Table 6.13 Farm Management Software by Key Companies in France
Table 6.14 Strategic Developments by Key Farm Management Software and Service Providers in France, June 2015-June 2018
Table 6.15 Italy Farm Management Software and Services Market (by Application), 2017-2023
Table 6.16 Italy Farm Management Software and Services Market (by Key Crop Type), $Million, 2017-2023
Table 6.17 Farm Management Software by Key Companies in Italy
Table 6.18 Strategic Developments by Key Farm Management Software and Service Providers in Italy, June 2015-June 2018
Table 6.19 Netherlands Farm Management Software and Services Market (by Application), $Million, 2017-2023
Table 6.20 Netherlands Farm Management Software and services Market (by Key Crop Type), $Million, 2017-2023
Table 6.21 Farm Management Software by Key Companies in the Netherlands
Table 6.22 Strategic Developments by Key Farm Management Software and Service Providers in the Netherlands, June 2015-June 2018
Table 6.23 Spain Farm Management Software and Services Market (by Application), $Million, 2017-2023
Table 6.24 Spain Farm Management Software and services Market (by Key Crop Types, by Value), $Million, 2017-2023
Table 6.25 Farm Management Software by Key Companies in Spain
Table 6.26 Strategic Developments by Key Farm Management Software and Service Providers in Spain, June 2015-June 2018
Table 6.27 Russia Farm Management Software and Services Market (by Application), $Million, 2017-2023
Table 6.28 Russia Farm Management Software and services Market (by Key Crop Type), $Million, 2017-2023
Table 6.29 Farm Management Software by Key Companies in Russia
Table 6.30 Ukraine Farm Management Software and Services Market (by Application), $Million, 2017-2023
Table 6.31 Ukraine Farm Management Software and services Market (by Key Crop Types, by Value), $Million, 2017-2023
Table 6.32 Farm Management Software by Key Companies in Ukraine
Table 6.33 Poland Farm Management Software and Services Market (by Application), $Million, 2017-2023
Table 6.34 Poland Farm Management Software and services Market (by Key Crop Types), $Million, 2017-2023
Table 6.35 Farm Management Software by Key Companies in Poland
Table 6.36 Austria Farm Management Software and Services Market (by Application), $Million, 2017-2023
Table 6.37 Austria Farm Management Software and Services Market (by Key Crop Types, $Million, 2017-2023
Table 6.38 Farm Management Software by Key Companies in Austria
Table 6.39 Total Agricultural Farms and Utilized Agricultural Area in Czech Republic (by Farm Size), 2016
Table 6.40 Czech Republic Farm Management Software and Services Market (by Application), $Million, 2017-2023
Table 6.41 Czech Republic Farm Management Software and Services Market (by Key Crop Types), $Million, 2017-2023
Table 6.42 Farm Management Software by Key Companies in Czech Republic
Table 7.1 365FarmNet: Product Portfolio
Table 7.2 Agrivi: Product Portfolio
Table 7.3 Deere & Company: Product Portfolio
Table 7.4 Hexagon Agriculture: Product Portfolio
Table 7.5 Topcon Positioning Systems: Product Portfolio
Table 7.6 Trimble Inc.: Product Portfolio
Table 7.7 DeLaval: Product Portfolio
Table 7.8 Fullwood Ltd.: Product Portfolio
Table 7.9 GEA Group: Product Portfolio
Table 7.10 Lely S.a.r.l: Product Portfolio
Table 7.11 Motorleaf Inc.: Product Portfolio
Table 7.12 AKVA Group: Product Portfolio
Figure 1 Europe Farm Management Software and Services Market Snapshot
Figure 2 Europe Farm Management Software and Services Market (by Delivery Model)
Figure 3 Europe Farm Management Software and Services Market (by Application), $Million
Figure 4 Europe Farm Management Software and Services Market (by Country)
Figure 1.1 Market Dynamics
Figure 1.2 Impact Analysis of Drivers
Figure 1.3 Reasons for Using Cloud Services in Percentage of Total Cloud Users in Europe, 2014
Figure 1.4 Daily Internet Usage by Adults in Great Britain, 2013-2016
Figure 1.5 Europe Nitrogen Fertilizer Consumption Forecast, 2014-2018
Figure 1.6 Change in Farm Size of European Union Countries (%), 2010-2013
Figure 1.7 Impact Analysis of Restraints
Figure 2.1 Strategies Adopted by the Key Players
Figure 2.2 Share of Key Market Strategies and Developments
Figure 2.3 Germany Crop Farm Management Software and Services Market Share Analysis, 2017
Figure 2.4 U.K. Crop Farm Management Software and Services Market Share Analysis, 2017
Figure 2.5 France Crop Farm Management Software and Services Market Share Analysis, 2017
Figure 2.6 Italy Crop Farm Management Software and Services Market Share Analysis, 2017
Figure 2.7 Netherlands Crop Farm Management Software and Services Market Share Analysis, 2017
Figure 2.8 Spain Crop Farm Management Software and Services Market Share Analysis, 2017
Figure 2.9 Russia Crop Farm Management Software and Services Market Share Analysis, 2017
Figure 2.10 Ukraine Crop Farm Management Software and Services Market Share Analysis, 2017
Figure 2.11 Poland Crop Farm Management Software and Services Market Share Analysis, 2017 (%)
Figure 2.12 Austria Crop Farm Management Software and Services Market Share Analysis, 2017
Figure 2.13 Czech Republic Crop Farm Management Software and Services Market Share Analysis, 2017
Figure 3.1 Porter’s Five Forces Analysis for Europe Farm Management Software and Services Market
Figure 3.2 Venture Capital Investments in Agri-Tech Sector, 2011-2015
Figure 3.3 Key Venture Capital Investments in Europe Farm Management Software and Services Market
Figure 4.1 Types of Farm Management Software and Services (by Delivery Model)
Figure 4.2 Farm Management Software and Services Market (by Delivery Model), 2018 and 2023
Figure 4.3 Advantages of On-Cloud Delivery Model
Figure 4.4 Disadvantages of Cloud-based Delivery Model
Figure 4.5 Cloud-Based Europe Farm Management Software and Services Market, 2017-2023
Figure 4.6 Use of Cloud Computing Services in Enterprises, 2016
Figure 4.7 Advantages of On-Premise Delivery Model
Figure 4.8 Disadvantages of On-Premise Delivery Model
Figure 4.9 On-Premise Europe Farm Management Software and Services Market, 2017-2023
Figure 4.10 Factors Limiting Enterprises from Using Cloud Computing Services (by Type of Enterprise), 2014
Figure 5.1 Applications of Farm Management Software and Services
Figure 5.2 Europe Farm Management Software and Services Market (by Application), 2018 and 2023
Figure 5.3 Types of Precision Crop Farming Applications
Figure 5.4 Livestock Monitoring and Management Application
Figure 5.5 Indoor Farming Application Areas
Figure 5.6 Aquaculture Application Areas
Figure 6.1 Europe Farm Management Software and Services Market (by Country), 2017 and 2023
Figure 6.2 Germany Farming and Agriculture Statistics, 2016
Figure 6.3 Importance of Agricultural Innovations to Total German Farmers (%), 2016
Figure 6.4 Germany Farm Management Software and Services Market, $Million, 2017-2023
Figure 6.5 Major End-Use Application of Farm Management Software and Services in Germany, 2017
Figure 6.6 Germany Farm Management Software and Services Market (by Key Crop Type)
Figure 6.7 The U.K. Farming and Agriculture Statistics, 2016
Figure 6.8 Adoption of Farm Management Software in the U.K. (by Farm Size), 2017
Figure 6.9 U.K. Farm Management Technology Adoption Curve
Figure 6.10 The U.K. Farm Management Software and Services Market, $Million, 2017-2023
Figure 6.11 Total Farmers in the U.K. (by Age), 2016
Figure 6.12 Major End-Use Application of Farm Management Software and services in U.K., 2017
Figure 6.13 The U.K. Farm Management Software and Services Market (by Key Crop Type)
Figure 6.14 France Farming and Agriculture Statistics, 2016
Figure 6.15 France Farm Management Software and Services Market, $Million, 2017-2023
Figure 6.16 Major End-Use Application of Farm Management Software and Services in France, 2017
Figure 6.17 France Farm Management Software and Services Market (by Key Crop Type)
Figure 6.18 Italy Farming and Agriculture Statistics, 2016
Figure 6.19 Italy Farm Management Software and services Market, 2017-2023 ($Million)
Figure 6.20 Major End-Use Application of Farm Management Software and Services in Italy 2017
Figure 6.21 Italy Farm Management Software and Services Market (by Key Crop Type)
Figure 6.22 The Netherlands Farming and Agriculture Statistics, 2016
Figure 6.23 Total Number of Farms in the Netherlands and Number of Farms (by Application)
Figure 6.24 The Netherlands Farm Management Software and Services Market, $Million, 2017-2023
Figure 6.25 Different Mode of Using Software in the Netherlands Farms, 2017
Figure 6.26 Total Farmers in the Netherlands (by Age), 2017
Figure 6.27 Farmers in the Netherlands (by Skill-Set), 2017
Figure 6.28 Major End-Use Applications of Farm Management Software and Services Market in the Netherlands, 2017
Figure 6.29 Netherlands Farm Management Software and Services Market (by Key Crop Type)
Figure 6.30 Spain Farming and Agriculture Statistics, 2016
Figure 6.31 Spain Farm Management Software and services Market, $Million, 2017-2023
Figure 6.32 Total Spanish Farmers (by Age), 2017
Figure 6.33 End-Use Applications of Farm Management Software and Services Market in Spain, 2017
Figure 6.34 Spain Farm Management Software and Services Market (by Key Crop Type)
Figure 6.35 Russia Farming and Agriculture Statistics, 2016
Figure 6.36 Russia Farm Management Software and services Market, $Million, 2017-2023
Figure 6.37 Major End-Use Application of Farm Management Software and Services in Russia, 2017
Figure 6.38 Russia Farm Management Software and Services Market (by Key Crop Type)
Figure 6.39 Ukraine Farming and Agriculture Statistics, 2016
Figure 6.40 Ukraine Farm Management Software and services Market, $Million, 2017-2023
Figure 6.41 Major End-Use Application of Farm Management Software and Services Market in Ukraine, 2017
Figure 6.42 Ukraine Farm Management Software and Services Market (by Key Crop Type)
Figure 6.43 Poland Farming and Agriculture Statistics, 2016
Figure 6.44 Factors Contributing to the Development of Poland Agricultural Sector
Figure 6.45 Different Modes of Using Software in the Total Poland Farms
Figure 6.46 Poland Farm Management Software and Services Market, $Million, 2017-2023
Figure 6.47 Key Drivers, Opportunities and Threats in the Poland Farm Management Software and Services Market
Figure 6.48 Major End-Use Application of Farm Management Software and Services in Poland, 2017
Figure 6.49 Poland Farm Management Software and Services Market (by Key Crop Type)
Figure 6.50 Austria Farming and Agriculture Statistics, 2016
Figure 6.51 Austria Farm Management Software and Services Market, $Million, 2017-2023
Figure 6.52 Major End-Use Application of Farm Management Software and Services in Austria, 2017
Figure 6.53 Austria Farm Management Software and Services Market (by Key Crop Type)
Figure 6.54 Czech Republic Farming and Agriculture Statistics, 2016
Figure 6.55 Czech Republic Farm Management Software and Services Market, $Million, 2017-2023
Figure 6.56 Total Czech Republic Farmers (by Age)
Figure 6.57 Major End-Use Application of Farm Management Software and Services in Czech Republic, 2017
Figure 6.58 Czech Republic Farm Management Software and Services Market (by Key Crop Type)
Figure 6.59 Rest of Europe Farm Management Software and Services Market, $Million, 2017-2023
Figure 7.1 Share of Key Companies
Figure 7.2 365FarmNet: SWOT Analysis
Figure 7.3 Agrivi: SWOT Analysis
Figure 7.4 Agroptima S.L: SWOT Analysis
Figure 7.5 Deere & Company: Overall Financials, 2015-2017
Figure 7.6 Deere & Company: Net Revenue (by Region), 2015-2017
Figure 7.7 Deere & Company: Net Revenue (by Business Segment), 2015-2017
Figure 7.8 Deere & Company: SWOT Analysis
Figure 7.9 Hexagon Agriculture: SWOT Analysis
Figure 7.10 Topcon Positioning Systems: SWOT Analysis
Figure 7.11 Trimble Inc.: Overall Financials, 2015-2017
Figure 7.12 Trimble Inc.: Net Revenue (by Region), 2015-2017
Figure 7.13 Trimble Inc.: Net Revenue by Business Segment, 2015-2016
Figure 7.14 Trimble Inc.: Net Revenue by Business Segment, 2017
Figure 7.15 Trimble Inc.: SWOT Analysis
Figure 7.16 DeLaval: SWOT Analysis
Figure 7.17 Fullwood Ltd.: SWOT Analysis
Figure 7.18 GEA Group: Overall Financials, 2015-17
Figure 7.19 GEA Group: Net Revenue by Geography, 2015-17
Figure 7.20 GEA Group: Net Revenue by Business Segment, 2015-17
Figure 7.21 GEA Group: SWOT Analysis
Figure 7.22 Lely S.a.r.l: SWOT Analysis
Figure 7.23 Motorleaf Inc.: SWOT Analysis
Figure 7.24 AKVA Group: Overall Financials, 2015-2017
Figure 7.25 AKVA Group: Net Revenue (by Region), 2015-2017
Figure 7.26 AKVA Group: Net Revenue (by Business Segment), 2015-2017
Figure 7.27 AKVA Group: SWOT Analysis
Figure 8.1 Europe Farm Management Software and Services Market Scope
Figure 8.2 Report Design
Figure 8.3 Primary Interviews Breakdown, by Player, Designation, and Region
Figure 8.4 Sources of Secondary Research
Figure 8.5 Data Triangulation
Figure 8.6 Top Down-Bottom-Up Approach for Market Estimation
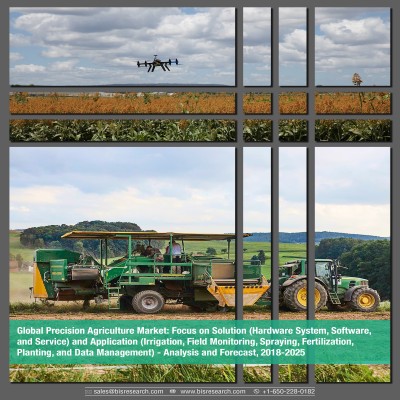
Over the last decade, the agricultural industry of Europe has witnessed a massive transformation owing to the increasing demand for sustainable farming practices. Rising urbanization and high-income growth, especially in the East European countries, have resulted in growing concerns of food security across the region. Various agricultural start-ups and technology innovators are developing numerous sustainable farming systems. With the rapid employment of advanced farming solutions, farmers can enhance production yield by increasing inputs and efficient management of farm enterprises.
The advent of innovative farm management techniques has resulted in the accumulation of enormous data. Moreover, there has been an increasing need for complete farm management software to automate and monitor various farm activities. Farm management software and services include the use of IoT and big data analytics to solve key challenges such as resource management, decision-making, and record-keeping.
This market research study offers a wide perspective of the different types of delivery models and applications pertaining to the Europe farm management software and services and analyzes its impact on the farming sector of the region by providing critical insights into the direction of its future expansion. The research is based on extensive primary interviews (in-house experts, industry leaders, and market players) and secondary research (a host of paid and unpaid databases), along with the analytical tools that have been used to build the forecast and the predictive models.
The report further includes a thorough analysis of the impact of the five major forces to understand the overall attractiveness of the industry. The report also focuses on the key developments and investments made in the Europe farm management software and services market by the players and government.
Further, the report includes an exhaustive country analysis of the European countries including Germany, France, the U.K., Italy, the Netherlands, Spain, Russia, U.K., Poland, Austria, Czech Republic, and the Rest-of-Europe. Each country details the individual drivering and restraining factors for the farm managemement software and services market in addition to the key players from that region. Deere & Company, 365FarmNet GmbH, Agrivi, Agroptima S.L., Hexagon Agriculture, Trimble Inc., DeLaval, Boumatic LLC, GEA Group, Fullwood Ltd., Lely S.a.r.l, Motorleaf Inc., Infarm, Lettus Grow Ltd, AKVA Group, and Integrated Information Systems S.A. are some of the prominent players in the Europe farm management software and services market.
The scope of this study was designed to answer some of the most crucial questions about the Europe farm management software and services market:
• What is the Europe farm management software and services market size in terms of revenue along with the growth rate during the forecast period 2018-2023?
• What is the revenue generated by farm management software and services for different applications in Europe?
• What are the major types of delivery models in the farm management software and services market in Europe?
• What is the revenue generated by farm management software and services for different applications?
• What are the major types of delivery models in the farm management software and services market?
• What are the key trends and opportunities in the market pertaining to countries included in the region?
• How attractive is the market for different stakeholders present in the industry by analyzing the futuristic scenario of the Europe farm management software and services market?
• What are the major driving forces that are expected to increase the demand during the forecast period?
• What are the major challenges inhibiting the growth of the Europe farm management software and services market?
• What kind of new strategies have been adopted by the existing market players to expand their market position in the industry?
• What is the competitive strength of the key players in the Europe farm management software and services market by analyzing their recent developments, product offerings, and country presence?
Augmented demand for high-quality yields and changes in farming structures across Europe have promoted the development of innovative business models for farm management. The demand for agricultural output in Europe is expected to increase heavily. However, the acreage cultivated in the region will rise only marginally. Finding ways to cater to the ever-increasing demand for food from the limited farmlands requires solutions that would help improve the productivity of the farm. To address the escalating demand for food from the limited farmlands and labor, the established agriculture machinery developers and technology vendors are introducing innovative solutions to the farming arena. These solutions are focused on helping farmers close the supply demand gap, by ensuring high yields, profitability, and protection of the environment. Use of such advanced solutions allows farmers to acquire enormous amount of site-specific data that can be applied to improve decision-making.
Farm management software and services assist in managing all the farm activities, so that the farm yields better results. Farm management software ensures the utilization of each acre of a farm to its maximum potential. This software also helps in ensuring that the application of fertilizer or crop protection chemicals and the irrigation of fields are effective and in precise quantities. Moreover, farm management software solutions also find applications in the management of livestock and aquaculture and in indoor farming control systems. The market for such solutions is expected to progress at a substantial rate due to the ever-growing affinity for more convenient cloud storage, which has been widely incorporated in the farm management software. Government bodies across the region have also realized the need and importance of these software and, thus, their initiatives to promote farming and agriculture further drive the growth of the market. The increasing farm size in most of the regions further promotes the growth of the farm management software and services market, as the need of software is more in larger farms where more data is generated, and its collection and analysis are more complicated.
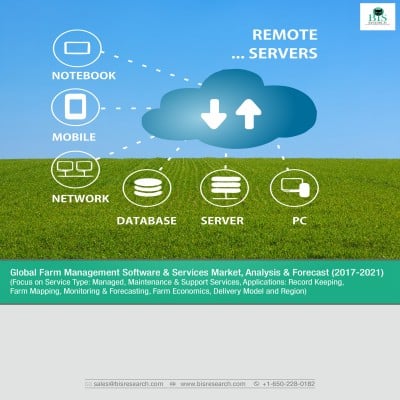
The concept of farm management software and services market revolves around the type of delivery model. Delivery model refers to the method by which a company provides its services to the customers. Farm management services can be provided with a server located in the farm premises or outside. If the server is located within the farm premises, it is termed as on-premise delivery, while if the server is not within the premises, it is termed as cloud-based delivery. On premise delivery model was most commonly used in early 2000s, but the rise of web and the easy access to data has made cloud-based delivery model more common. Farm management software and services have applications covering most of the farming types including precision crop farming, livestock monitoring and management, indoor farming, aquaculture, and others (forestry and orchids). Major applications include yield monitoring, crop scouting, weather monitoring and forecasting, herd management, indoor climate control, and fish tracking, among others.
A dominant market share in the European nation is contributed by Germany, U.K., and France and is expected to continue during the forecast years. However, of late, there has been an increasing optimism regarding the Eastern European markets of Poland, Czech Republic, and Austria. The Common Agriculture Policy (CAP) has played a significant role in changing the scenario of the agricultural sector in Europe. Germany is expected to dominate the regional farm management software and services market in the year 2018. The leading companies in the farm management software and services market have their headquarters in European countries. These include Agrivi (U.K.), Datalogisk A/S (Denmark), Agrovision B.V. (Netherlands), and Abacus Agriculture (U.K.), among others.
Competitive Landscape
The competitive landscape for the farm management software and services market demonstrates an inclination toward companies adopting strategies such as product launch and development and partnerships and collaborations. The major established players in the market are focusing on product launches and developments to introduce new forms of innovations. Trimble Navigation, Iteris Inc., AgJunction, Ag Leader, The Climate Corporation, Hexagon Agriculture, Raven Industries, and Topcon Positioning Systems were the most prominent names that surfaced in 2017 in this regard. These companies launched various new products and brought new developments to their existing products to expand their share in the market.
The need for more R&D and appropriate regulatory environment is a prerequisite for the sustained growth of this market. Various governments and private research institutes and regulatory bodies and associations are putting in substantial efforts to identify how farm management software can be important for required food production. The need for sophisticated farming techniques is necessary to fulfill the increasing demand for food. Farm management software not only makes farming more productive but also helps in attracting the youth toward farming and agriculture.
Focus on Delivery Model (On-Cloud and On-Premise), Application (Precision Crop Farming, Livestock Monitoring, and Indoor Farming and Aquaculture), and Country
The precision agriculture market is projected to grow from $4.29 billion in the year 2018 to...
The farm management software and services market is expected to reach $2,883.4 million by...
1. Please contact us to discuss customization options, and we can confirm the time and cost (if any). For minor customization requirements that would take 3-5 days, we do not charge any additional amount.
2. All BIS Research reports are delivered to clients via our InsightMonk platform. This allows the customers to extract the data in Excel for their use. Excel is provided for all License types and is not limited to just enterprise users.
3. Additionally, all customers also get access to the following complimentary value-added services from BIS Research.
*Expert Consultation Charges applicable