Published Year: 2018
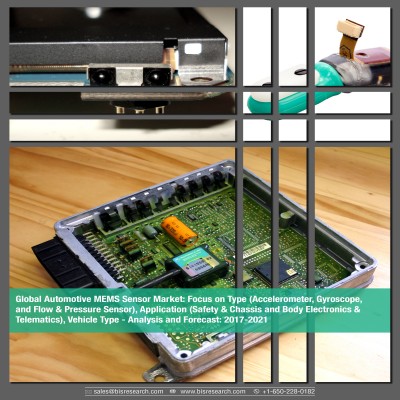
Global Automotive MEMS Sensor Market: Focus on Type (Accelerometer, Gyroscope, and Flow & Pressure S
The automotive MEMS sensor market by volume is estimated to witness a growth at a CAGR of ~13%...
Focus on Sensor Types, Vehicle Types, Regional Study (15 Countries), Market Share, and Industry Insights – Analysis and Forecast, 2017-2021
Delivery Time: 1-5 Working Days
Get ISO Certified Research, Customization, Data Extraction, and Value-Added Services with All BIS Research Reports
BIS Research provides a comprehensive report library with unlimited access to data, insights, and market intelligence through Subscription.
Get Subscription Know More
1 Market Dynamics
1.1 Overview
1.2 Drivers
1.2.1 Increasing Safety and Security Concerns among Automotive Consumers
1.2.2 Stringent Government Regulations to Depreciate Increasing Levels of Pollution and Greenhouse Gases, Globally
1.2.3 Growing Sales of Luxury Vehicles
1.3 Restraints
1.3.1 Pricing Pressure for Sensor Manufacturers
1.3.2 Fluctuation in Raw Material Prices
1.4 Opportunities
1.4.1 Growing Demand of Electric and Autonomous Vehicles
1.4.2 Advancements in Sensor Technologies
2 Competitive Landscape
2.1 Overview
2.1.1 Product Launches
2.1.2 Joint Ventures, Partnerships, and Collaborations
2.1.3 Mergers and Acquisitions
2.1.4 Others
2.2 R&D Analysis
2.3 Global Automotive Cabin Air Quality Sensor Market: Leading Player Analysis
3 Industry Analysis
3.1 Overview
3.2 Supply Chain Analysis
3.3 Demand and Supply Side Analysis
3.3.1 Demand Side Analysis
3.3.2 Supply Side Analysis
3.4 Pricing Analysis
3.5 Patent Analysis
4 Global Automotive Cabin Air Quality Sensor Market (by Vehicle Type)
4.1 Assumptions and Limitations
4.2 Global Automotive Cabin Air Quality Sensor Market Overview
4.3 Global Automotive Cabin Air Quality Sensor Market (by Vehicle Type)
4.3.1 Passengers Cars
4.3.2 Electric Vehicles
5 Global Automotive Cabin Air Quality Sensor Market (by Type)
5.1 Market Overview
5.2 Semiconducting Metal Oxide (SMO)
5.3 Non-Dispersive Infrared Sensors (NDIR)
6 Global Automotive Cabin Air Quality Sensor Market (by Region)
6.1 Market Overview
6.2 North American Free Trade Agreement (NAFTA)
6.2.1 The U.S.
6.2.2 Canada
6.2.3 Mexico
6.3 Europe
6.3.1 The U.K.
6.3.2 France
6.3.3 Italy
6.3.4 Russia
6.3.5 Rest-of-Europe
6.4 Asia-Pacific
6.4.1 China
6.4.2 Japan
6.4.3 India
6.4.4 South Korea
6.4.5 Rest-of-Asia-Pacific
6.5 Rest-of-the-World (RoW)
6.5.1 Middle East & Africa
6.5.2 South America
7 Company Profiles
7.1 Overview
7.2 Amphenol Corporation
7.2.1 Company Overview
7.2.2 Product Portfolio
7.2.3 Financials
7.2.3.1 Financial Summary
7.2.4 SWOT Analysis
7.3 ams AG
7.3.1 Company Overview
7.3.2 Product Portfolio
7.3.3 Financials
7.3.3.1 Financial Summary
7.3.4 SWOT Analysis
7.4 Axetris AG
7.4.1 Company Overview
7.4.2 Product Portfolio
7.4.3 Corporate Summary
7.4.4 SWOT Analysis
7.5 City Technologies Ltd.
7.5.1 Company Overview
7.5.2 Product Portfolio
7.5.3 Corporate Summary
7.5.4 SWOT Analysis
7.6 FIGARO Engineering Inc.
7.6.1 Company Overview
7.6.2 Product Portfolio
7.6.3 Corporate Summary
7.6.4 SWOT Analysis
7.7 NISSHA FIS, Inc.
7.7.1 Company Overview
7.7.2 Product Portfolio
7.7.3 Corporate Summary
7.7.4 SWOT Analysis
7.8 Paragon AG
7.8.1 Company Overview
7.8.2 Product Portfolio
7.8.3 Financials
7.8.3.1 Financial Summary
7.8.4 SWOT Analysis
7.9 Prodrive Technologies
7.9.1 Company Overview
7.9.2 Product Portfolio
7.9.3 Corporate Summary
7.9.4 SWOT Analysis
7.10 Sensata Technologies Holding N.V.
7.10.1 Company Overview
7.10.2 Product Portfolio
7.10.3 Financials
7.10.3.1 Financial Summary
7.10.4 SWOT Analysis
7.11 Sensirion Holding AG
7.11.1 Company Overview
7.11.2 Product Portfolio
7.11.2.1 Financial Summary
7.11.3 SWOT Analysis
7.12 SGX Sensortech
7.12.1 Company Overview
7.12.2 Product Portfolio
7.12.3 Corporate Summary
7.12.4 SWOT Analysis
7.13 Standard Motor Products, Inc.
7.13.1 Company Overview
7.13.2 Product Portfolio
7.13.3 Financials
7.13.3.1 Financial Summary
7.13.4 SWOT Analysis
7.14 Umwelt Sensor Technik (UST) GmbH
7.14.1 Company Overview
7.14.2 Product Portfolio
7.14.3 Corporate Summary
7.14.4 SWOT Analysis
7.15 Valeo Group
7.15.1 Company Overview
7.15.2 Product Portfolio
7.15.3 Financials
7.15.3.1 Financial Summary
7.15.4 SWOT Analysis
7.16 Zhengzhou Winsen Electronics Technology Co., Ltd.
7.16.1 Company Overview
7.16.2 Product Portfolio
7.16.3 Corporate Summary
7.16.4 SWOT Analysis
8 Report Scope and Methodology
8.1 Scope of the Report
8.2 Cabin Air Quality Sensor Market Research Methodology
8.2.1 Primary Data Sources
8.2.2 Secondary Data Sources
8.2.3 Assumptions and Limitations
List of Tables
Table 1.1 Regulations and Guidelines
Table 2.1 New Product Launches (January 2015-May 2018)
Table 2.2 Joint Ventures, Partnerships, and Collaborations (January 2015-May 2018)
Table 2.3 Mergers and Acquisitions (January 2015-May 2018)
Table 2.4 Others (January 2015-May 2018)
Table 3.1 Global Automotive Cabin Air Quality Sensor Market: Key Patents
Table 4.1 Global Automotive Cabin Air Quality Sensor Market (by Vehicle Type), Value & Volume, 2016-2021
Table 4.2 Global Automotive Cabin Air Quality Sensor Market for Passenger Cars, 2016-2021
Table 4.3 Global Automotive Cabin Air Quality Sensor Market for Electric Vehicles, 2016-2021
Table 5.1 Comparison of Cabin Air Quality Sensor Technologies
Table 5.2 Global Automotive Cabin Air Quality Sensor Market (by Type), Value & Volume, 2016-2021
Table 6.1 Global Automotive Cabin Air Quality Sensor Market (by Region), Value & Volume, 2016-2021
Table 6.2 NAFTA Cabin Air Quality Sensor Market (by Vehicle Type), Value & Volume, 2016-2021
Table 6.3 Europe Cabin Air Quality Sensor Market (by Vehicle Type), Value & Volume, 2016-2021
Table 6.4 Asia Pacific Cabin Air Quality Sensor Market (by Vehicle Type), (Value & Volume), 2016-2021
Table 6.5 Middle East Cabin Air Quality Sensor Market for Passenger Car (by Country), 2016-2021
Table 6.6 Africa Cabin Air Quality Sensor Market for Passenger Car (by Country), 2016-2021
Table 6.7 South America Cabin Air Quality Sensor Market for Passenger Car (by Country), 2016-2021
Figure 1 Factors Affecting the Growth of Global Automotive Cabin Air Quality Sensor Market
Figure 2 Global Automotive Cabin Air Quality Sensor Market
Figure 3 Global Cabin Air Quality Sensor Market by Vehicle Type
Figure 4 Global Automotive Cabin Air Quality Sensor Market (by Sensor Type)
Figure 5 Global Automotive Cabin Air Quality Sensor Market (by Region)
Figure 1.1 Market Dynamics
Figure 1.2 Toxic Gases Affecting Cabin Air Quality
Figure 1.3 Sales of Luxury Vehicles by Region, 2012-2016
Figure 1.4 Global Sales of Electric and Autonomous Vehicles, 2010-2016
Figure 2.1 Key Developments and Strategies (January 2015-May 2018)
Figure 2.2 R&D Investment of Some Prominent Players
Figure 2.3 Global Automotive Cabin Air Quality Sensor Market: Leading Players Analysis
Figure 2.4 Market Share Analysis
Figure 3.1 Supply Chain Analysis
Figure 3.2 Automobile Sales Across Countries, 2016 and 2022
Figure 3.3 PM2.5 Concentration Level Across Different Cities
Figure 3.4 Average Selling Price of Air Quality Sensor (2016-2021)
Figure 4.1 Global Automotive Cabin Air Quality Sensor Market, 2016-2021
Figure 4.2 Global Automotive Cabin Air Quality Sensor Market (by Vehicle Type)
Figure 4.3 Global Automotive Cabin Air Quality Sensor Market (by Vehicle Type), 2016-2021
Figure 4.4 Types of Passenger Cars
Figure 4.5 Global Automotive Cabin Air Quality Sensor Market for Passenger Cars, 2017 and 2021
Figure 4.6 Types of Electric Vehicles
Figure 4.7 Global Automotive Cabin Air Quality Sensor Market for Electric Vehicles, 2017 and 2021
Figure 5.1 Global Automotive Cabin Air Quality Sensor Market (by Type)
Figure 5.2 Global Automotive Cabin Air Quality Sensor Market (by Type), 2016-2021
Figure 6.1 Global Automotive Cabin Air Quality Sensor Market Snapshot (by Region)
Figure 6.2 NAFTA Passenger Car Cabin Air Quality Sensor Market (by Country)
Figure 6.3 NAFTA Cabin Air Quality Sensor Market (by Vehicle Type), 2017 and 2021
Figure 6.4 Europe Passenger Car Cabin Air Quality Sensor Market (by Country)
Figure 6.5 Europe Cabin Air Quality Sensor Market (by Vehicle Type)
Figure 6.6 Asia-Pacific Passenger Car Cabin Air Quality Sensor Market (by Country)
Figure 6.7 Asia-Pacific Cabin Air Quality Sensor Market (by Vehicle Type)
Figure 6.8 RoW Passenger Car Cabin Air Quality Sensor Market (by Country)
Figure 7.1 Share of Key Company Profiles
Figure 7.2 Amphenol Corporation: Product Portfolio
Figure 7.3 Amphenol Corporation: Overall Financials, 2015-2017
Figure 7.4 Amphenol Corporation: Net Revenue by Region, 2015-17
Figure 7.5 Amphenol Corporation: Net Revenue by Business Segment, 2015-17
Figure 7.6 Amphenol Corporation: SWOT Analysis
Figure 7.7 ams AG: Product Portfolio
Figure 7.8 ams AG: Overall Financials, 2015-2017
Figure 7.9 ams AG: Net Revenue by Region, 2015-2017
Figure 7.10 ams AG: Net Revenue by Business Segment, 2015-17
Figure 7.11 ams AG: SWOT Analysis
Figure 7.12 Axetris AG: Product Portfolio
Figure 7.13 Axetris AG: SWOT Analysis
Figure 7.14 City Technologies Ltd.: Product Portfolio
Figure 7.15 City Technologies Ltd.: SWOT Analysis
Figure 7.16 FIGARO Engineering Inc.: Product Portfolio
Figure 7.17 FIGARO Engineering Inc.: SWOT Analysis
Figure 7.18 NISSHA FIS, Inc.: Product Portfolio
Figure 7.19 NISSHA FIS, Inc.: SWOT Analysis
Figure 7.20 Paragon AG: Product Portfolio
Figure 7.21 Paragon AG: Overall Financials, 2015-17
Figure 7.22 Paragon AG: Net Revenue by Region, 2015-17
Figure 7.23 Paragon AG: Net Revenue by Business Segment, 2015-17
Figure 7.24 Paragon AG: SWOT Analysis
Figure 7.25 Prodrive Technologies: Product Portfolio
Figure 7.26 Prodrive Technologies: SWOT Analysis
Figure 7.27 Sensata Technologies Holdings N.V.: Product Portfolio
Figure 7.28 Sensata Technologies Holdings N.V.: Overall Financials, 2015-17
Figure 7.29 Sensata Technologies Holdings N.V.: Net Revenue by Region, 2015-17
Figure 7.30 Sensata Technologies Holdings N.V.: Net Revenue by Business Segment, 2015-17
Figure 7.31 Sensata Technologies Holdings N.V.: Sensing Solutions, 2015-17
Figure 7.32 Sensata Technologies Holdings N.V.: Performing Sensing, 2015-17
Figure 7.33 Sensata Technologies Holdings N.V.: SWOT Analysis
Figure 7.34 Sensirion Holding AG: Product Portfolio
Figure 7.35 Sensirion Holding AG: SWOT Analysis
Figure 7.36 SGX Sensortech: Product Portfolio
Figure 7.37 SGX Sensortech: SWOT Analysis
Figure 7.38 Standard Motor Products, Inc.: Product Portfolio
Figure 7.39 Standard Motor Products, Inc.: Overall Financials, 2015-17
Figure 7.40 Standard Motor Products, Inc.: Net Revenue by Region, 2015-17
Figure 7.41 Standard Motor Products, Inc.: Net Revenue by Business Segment, 2015-17
Figure 7.42 Standard Motor Products, Inc.: SWOT Analysis
Figure 7.43 Umwelt Sensor Technik GmbH: Product Portfolio
Figure 7.44 UST GmbH: SWOT Analysis
Figure 7.45 Valeo Group: Product Portfolio
Figure 7.46 Valeo Group: Overall Financials, 2015-17
Figure 7.47 Valeo Group: Net Revenue by Region, 2015-17
Figure 7.48 Valeo Group: Net Revenue by Business Segment, 2015-17
Figure 7.49 Valeo Group: SWOT Analysis
Figure 7.50 Zhengzhou Winsen Electronics Technology Co., Ltd.: Product Portfolio
Figure 7.51 Zhengzhou Winsen Electronics Technology Co., Ltd.: SWOT Analysis
Figure 8.1 Scope of the Report
Figure 8.2 Report Design
Figure 8.3 Secondary Data Sources
Figure 8.4 Bottom-Up Approach
Figure 8.5 Air Quality Sensor Market Influencing Factors
Figure 8.6 Assumptions and Limitations
• What is the expected global automotive cabin air quality sensor market size in terms of revenue and volume in the period 2017-2021?
• What is the dominant type of sensor used in the vehicle’s cabin?
• What is the revenue generated by the different sensor types, and vehicle types of the automotive cabin air quality sensor market during the period 2017-2021?
• Which vehicle type will lead by value and volume in the global automotive cabin air quality sensors market by the end of the forecast period?
• What will be the different factors driving the market during the forecast period?
• What are the major factors challenging the growth of the global automotive cabin air quality sensor market?
• What kind of new strategies are being adopted by the existing market players to make a mark in the industry?
• Which region will lead the global automotive cabin air quality sensors market by the end of the forecast period?
Globally rising level of air-pollution, deteriorating cabin air quality, and growing awareness toward passenger safety and comfort have resulted in an increased demand for automotive cabin air quality sensor. Moreover, stringent governmental regulations toward automotive emission, amount of CO2 released by vehicles and its concentration within the passenger cabin have also led to the burgeoning demand for air quality control systems. The automotive cabin air quality sensor market is estimated to witness robust growth during the period 2016-2022. The report is a compilation of various segmentations including a market breakdown by sensor type, vehicle type, and geographical areas.
The report details the market analysis and forecast with respect to its various sensor types such as semiconductor metal oxide sensor and non-dispersive infrared sensor. While highlighting the key driving and restraining forces for this market, the report also provides a detailed study of the different vehicles that are analyzed including passenger cars (compact, mid-size, and luxury) and electric vehicles (battery electric vehicles and hybrid electric vehicles). It also details the leading players involved in the industry and provides an overview of the demand and supply side analysis of the market.
The report includes an exhaustive analysis of the geographical split into NAFTA (the U.S, Canada, Mexico), Europe (Germany, the U.K, France, Italy, Russia, Rest-of-Europe), Asia-Pacific (China, Japan, South Korea, India, and Rest-of-APAC), South America, and Middle East & Africa. Each geographical region analysis details the individual push and pull forces in addition to the key players from that particular region.
The report examines the role of the leading market players involved in the industry. The Company Profiles section includes highlights of significant information about the key companies involved along with their financial positions, key strategies & developmental activities of recent years (2014-2018). Some of the key players in the cabin air quality sensor market include ams AG, Axetris, Amphenol Corporation, Sensata Technologies, SGX Sensortech, Figaro Engineering, FIS Inc., and Paragon AG.
The automobile industry is undergoing dynamic evolution which is primarily attributed to the changing consumer preferences, growing focus toward driver safety, rising environmental concerns, and stringent government regulations aiming toward crash avoidance rather than crash survival. In the last decade, automobiles have undergone massive technological advancements in terms of vehicle performance, passenger safety, communication capabilities, driving comfort, and disruptive trends such as ride-hailing and car sharing facilities. These improvements have led to a surge in the number of on-road vehicles, elevating the need for the safer movement of automobiles. Additionally, a high number of vehicles has also led to a massive increase in the air pollution, globally.
Among multiple problems affecting passengers, the problem of air pollution is the most devastating, causing a direct and serious threat to the well-being of the passengers. Air quality inside the cabin of any vehicle is four to five times worse than the quality outside the vehicle. Several independent studies have shown that the concentration of Carbon Monoxide (CO), Hydrocarbons (HCs), and Nitrous Compounds (NOx) found inside the vehicle cabins was detrimentally high.
High concentration of these pollutants inside the vehicle is responsible for multiple health-related issues including fatigue, headaches, dizziness, and nausea. Fatigue has been regarded as the sole reason for 20% of the fatalities related to accidents. It often leads to lack of sleep, loss of alertness, inability to concentrate, and slow reaction. In order to deal with these problems, automotive Original Equipment Manufacturers (OEMs) have started appending air quality control or monitoring systems in vehicles as a factory installed offering. Initially, air quality control feature was reserved for the top range vehicles, however, lower manufacturing costs of sensors as well as high awareness of the public pertaining to air quality, in general, has widened the use of Air Quality Sensors (AQS).
The report defines and estimates the market size and future growth potential of cabin air quality sensor market during the period 2017-2021. The global cabin air quality sensor market revenue is expected to reach $1,362.7 million by 2021 growing at a CAGR of 18.4% in the period 2017-2021. The global cabin air quality sensor market has been driven by increasing demand of passenger cars and electric vehicles, growing awareness pertaining to air quality, safety, and health concerns, and improved offering from automotive OEMs at the convenient price point.
In addition to this, an increase in the number of product developments, collaborations, and merger and acquisitions, among others, are also witnessed in the past few years, thus fueling the growth of the automotive cabin air quality sensor market.
In terms of vehicle category, passenger car segment is the most dominant one, owing to high sales of passenger cars especially in developing countries and increasing demand for passenger comfort and safety features across all types of vehicles. Electric vehicles category also holds tremendous potential in terms of market growth for cabin air quality sensors. Electric vehicles are widely regarded as the future of mobility and are witnessing high demand across all the major geographical regions including APAC, Europe, and North America.
Semiconductor metal oxide sensors is the dominant category accounting for the lion-share of the total cabin air quality sensor market in 2017. Low cost, reliable performance, and small form factor are some of the reasons for the wide-scale adoption of the Semiconductor Metal-Oxide (SMO) sensors in automotive applications.
Europe dominated the global cabin air quality sensor market in the year 2017. This was majorly due to the high demand of electric vehicles in Europe and growing focus toward passenger safety and comfort. In addition, favorable government regulations in Europe are also an important factor driving the demand for cabin air quality sensors.
Some of the key players in the cabin air quality sensor market include ams AG, Axetris, Amphenol Corporation, Sensata Technologies, SGX Sensortech, Figaro Engineering, FIS Inc., and Paragon AG.
Focus on Sensor Types, Vehicle Types, Regional Study (15 Countries), Market Share, and Industry Insights – Analysis and Forecast, 2017-2021
The automotive MEMS sensor market by volume is estimated to witness a growth at a CAGR of ~13%...

The global ADAS and autonomous driving components market generated $2.76 billion in 2016. The...

The overall demand for automotive sensors is significantly growing owing to factors such as...
1. Please contact us to discuss customization options, and we can confirm the time and cost (if any). For minor customization requirements that would take 3-5 days, we do not charge any additional amount.
2. All BIS Research reports are delivered to clients via our InsightMonk platform. This allows the customers to extract the data in Excel for their use. Excel is provided for all License types and is not limited to just enterprise users.
3. Additionally, all customers also get access to the following complimentary value-added services from BIS Research.
*Expert Consultation Charges applicable