A quick peek into the report
Global Companion Diagnostics Market Industry Overview
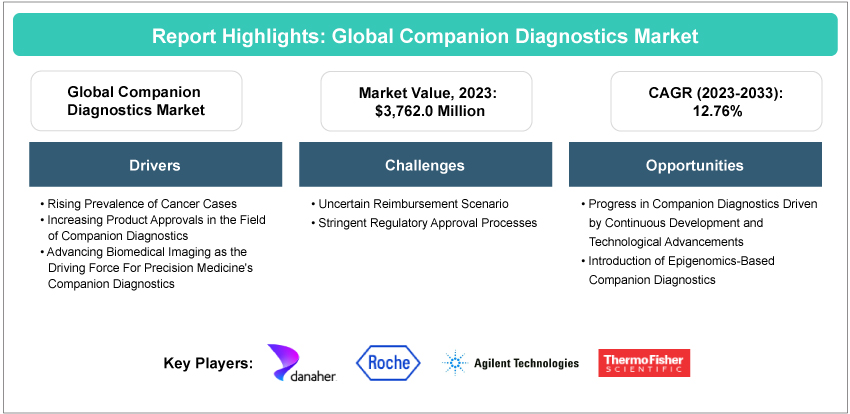
The global companion diagnostics market was valued at $3,762.0 million in 2023 and is expected to reach $12,498.7 million by 2033, growing at a CAGR of 12.76% between 2023 and 2033. The growth of the companion diagnostics market is driven by the rising prevalence of cancer cases, increasing product approvals in the field of companion diagnostics, and advancing biomedical imaging as the driving force for precision medicine’s companion diagnostics.
Market Introduction
The companion diagnostics market has emerged as a pivotal component in the realm of personalized medicine, transforming the landscape of disease diagnosis and treatment. This innovative sector focuses on developing diagnostic tests that aid in the identification of biomarkers and genetic variations associated with specific diseases. The primary objective of companion diagnostics is to enable healthcare professionals to tailor treatment plans according to the individual characteristics of patients, ensuring a more targeted and effective approach. With the rising prevalence of complex diseases such as cancer, the demand for companion diagnostics has grown significantly.
The market's evolution has been characterized by a blend of technological advancements, strategic collaborations between pharmaceutical and diagnostic companies, and regulatory efforts to ensure the safety and efficacy of these diagnostic tools. As the healthcare industry continues to embrace precision medicine, the companion diagnostics market stands at the forefront, poised to make substantial contributions to the era of personalized and more effective medical interventions.
Industrial Impact
The advent of the companion diagnostics market has had a profound industrial impact, particularly within the realms of healthcare, diagnostics, and pharmaceuticals. This innovative sector has fundamentally altered the traditional approach to disease diagnosis and treatment by introducing personalized and targeted strategies. Pharmaceutical companies are increasingly integrating companion diagnostics into their drug development pipelines, facilitating the identification of biomarkers and the selection of patient populations that are most likely to respond positively to specific therapies.
Market Segmentation:
Segmentation 1: by Technology
• Polymerase Chain Reaction (PCR)
• Immunohistochemistry (IHC)
• In-Situ Hybridization (ISH)
• Next-Generation Sequencing (NGS)
• Others
PCR Segment to Dominate the Companion Diagnostics Market (by Technology)
Based on technology, the global companion diagnostics market was led by PCR in 2022 primarily due to its exceptional accuracy and sensitivity in detecting nucleic acid sequences, making it particularly adept at identifying specific genetic mutations or biomarkers associated with diseases. This precision enables clinicians to make personalized treatment decisions based on reliable diagnostic information. Additionally, PCR's versatility allows it to detect a wide range of genetic variations, including single nucleotide polymorphisms (SNPs) and gene fusions, facilitating the development of companion diagnostics for diverse diseases and therapeutic targets. Furthermore, PCR techniques, such as real-time PCR (qPCR), offer rapid turnaround times, enabling timely diagnosis and treatment monitoring, which is crucial in companion diagnostics.
Segmentation 2: by Application
• Lung Cancer
• Breast Cancer
• Colorectal Cancer
• Leukemia
• Stomach Cancer
• Melanoma
• Others
Lung Cancer Segment to Witness the Highest Growth between 2023 and 2033
The lung cancer segment holds the largest share in the companion diagnostics market for several compelling reasons. Firstly, lung cancer is one of the most prevalent and deadliest forms of cancer worldwide, driving the demand for effective diagnostic tools to guide treatment decisions. Companion diagnostics play a crucial role in lung cancer management by identifying specific genetic mutations or biomarkers that can inform targeted therapy selection. For example, mutations in genes such as EGFR, ALK, ROS1, and BRAF are commonly found in non-small cell lung cancer (NSCLC) and are associated with responses to targeted therapies.
Segmentation 3: by End User
• Pharmaceutical and Biotechnology Companies
• Reference Laboratories and Hospitals
• Others
Reference Laboratories and Hospitals Segment to Witness the Highest Growth between 2023 and 2033
Reference laboratories and hospitals hold a significant share of the end user market in the global companion diagnostics market for several reasons. The reference laboratories and hospitals typically have access to advanced diagnostic technologies and expertise, which allows them to perform complex molecular testing required for companion diagnostics. These facilities often have state-of-the-art equipment and trained personnel capable of conducting molecular assays with high accuracy and precision, which is crucial for reliable companion diagnostic testing.
Moreover, reference laboratories and hospitals serve as central hubs for patient care, where individuals seek diagnosis and treatment for various diseases, including those requiring companion diagnostics. As a result, these facilities handle a large volume of diagnostic testing, providing economies of scale and driving demand for companion diagnostics.
Segmentation 5: by Region
• North America
o U.S.
o Canada
• Europe
o Germany
o U.K.
o France
o Italy
o Spain
o Rest-of-Europe
• Asia-Pacific
o Japan
o India
o China
o South Korea
o Australia
o Rest-of-Asia-Pacific
• Latin America
o Brazil
o Mexico
o Rest-of-Latin America
• Middle East and Africa
o South Africa
o U.A.E.
o Rest-of-Middle East and Africa
The North America region is expected to hold a significant share of the global companion diagnostics market for several reasons. North America, particularly the U.S., boasts advanced healthcare infrastructure and a strong emphasis on precision medicine initiatives. This environment fosters the adoption of companion diagnostics, which play a vital role in guiding targeted therapies and improving patient outcomes.
The region is home to a large number of pharmaceutical and biotechnology companies engaged in the development of targeted therapies. These companies often collaborate with diagnostic companies to co-develop companion diagnostics alongside their therapeutic products. As a result, there has been a rise in demand for companion diagnostics in North America to support the use of these targeted therapies in clinical practices.
Recent Developments in the Companion Diagnostics Market
• In August 2023, Amoy Diagnostics Co., Ltd entered into a collaboration agreement with AstraZeneca. As per the agreement, AmoyDx's Essential NGS panel can be utilized as a companion diagnostic for ENHERTU. This diagnostic tool would be used to identify HER2 (ERBB2) mutations, specifically in patients with non-small cell lung cancer (NSCLC).
• In March 2023, Illumina Inc. and Myriad Genetics Inc. announced an expansion of their strategic partnership to enhance access to and availability of oncology homologous recombination deficiency (HRD) testing in the U.S. As part of the agreement, Illumina TruSight Oncology 500 HRD (TSO 500 HRD), initially a research-use-only test, would now be accessible in the U.S. The expanded collaboration would further establish a unique companion diagnostic (CDx) alliance for the pharmaceutical industry.
• In November 2023, Abbott Laboratories got approval from the U.S. Food and Drug Administration (FDA) for its HPV screening solution. This new tool can help identify high-risk HPV infections and would now be part of the Alinity m family of diagnostic tests, strengthening its capabilities in cancer screening.
• In December 2022, the U.S. Food and Drug Administration (FDA) granted approval for Agilent Technologies, Inc.'s Resolution ctDx FIRST to serve as a companion diagnostic (CDx). This approval would allow the use of Resolution ctDx FIRST to identify patients with advanced non-small cell lung cancer (NSCLC) who have KRAS G12C mutations. The purpose would be to identify individuals who could potentially benefit from treatment with KRAZATITM (adagrasib).
Demand – Drivers, Challenges, and Opportunities
Market Demand Drivers:
Increasing Product Approvals in the Field of Companion Diagnostics: As the range of approved companion diagnostic products widens, healthcare providers would gain access to more sophisticated tools that enable precise patient stratification, ultimately contributing to improved therapeutic outcomes and the realization of the promise of personalized medicine.
Market Challenges:
Uncertain Reimbursement Scenario: The companion diagnostics market faces a notable impediment in the form of an uncertain reimbursement scenario, casting a shadow over its potential growth and adoption. This uncertainty introduces financial challenges for healthcare providers, who heavily depend on reimbursements to offset the costs associated with integrating companion diagnostics into their clinical practices.
Market Opportunities:
Continuous Developments and Technological Advancements to Drive Progress in Companion Diagnostics: The landscape of companion diagnostics is continually shaped by ongoing developments and technological evolution. Advancements in genetic and molecular research have paved the way for a deeper understanding of disease mechanisms at the molecular level. This progress has led to the identification and validation of a plethora of biomarkers, allowing for more precise and targeted diagnostic approaches.
Analyst’s Thoughts
According to Swati Sood, Principal Analyst – BIS Research, “The growth of the companion diagnostics market has been primarily driven by increasing product approvals in the field of companion diagnostics and advancing biomedical imaging as the driving force for precision medicine's companion diagnostics.”
Companion Diagnostics Market - A Global and Regional Analysis
Focus on Application, End User, Technology, and Region - Analysis and Forecast, 2023-2033
Frequently Asked Questions
Companion diagnostics refer to a specialized category of diagnostic tests that are designed to identify specific biomarkers, genetic mutations, or other molecular characteristics in patients. These diagnostics are closely tied to the field of personalized medicine, aiming to provide healthcare professionals with crucial information about an individual's unique biological profile.
Existing companion diagnostics players are continually exploring various strategies to enhance their market position in the industry, such as continuous research and development to introduce innovative technologies and automated systems with improved efficiency, accuracy, and versatility. Companies may invest in developing advanced instruments and software to stay ahead of the competition.
The following are the USPs of this report:
• Market regulations and a list of key trends in the companion diagnostics market
• A competitive index of the market specific to the unmet needs and innovations of the key players
• Key challenges faced by manufacturers
• Market dynamic analysis of the opportunities, trends, and challenges in the market
• Competitive benchmarking of key players for each product type
The global companion diagnostics report gives a detailed analysis of all aspects of the market. This can be useful to manufacturers, service providers, and any of the end users to make informed decisions and enable targeted marketing, strategic planning, product benchmarking, and better resource allocation, among other things.