Published Year: 2026
AI-Enabled Imaging Modalities Market - A Global and Regional Analysis: Focus on Modality, Applicatio
The global AI-enabled imaging modalities market is projected to reach $17,847.6 million by...
Focus on Product Type, Imaging Type, Imaging Modality, Application, End User, Regional, and Country - Analysis Forecast, 2026-2036
Delivery Time: 1 Working Day
Get ISO Certified Research, Customization, Data Extraction, and Value-Added Services with All BIS Research Reports
BIS Research provides a comprehensive report library with unlimited access to data, insights, and market intelligence through Subscription.
Get Subscription Know More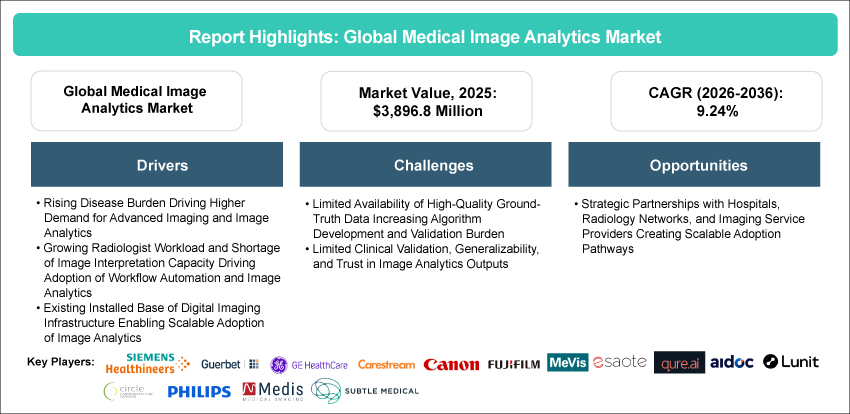
Introduction of the Global Medical Image Analytics Market
The global medical image analytics market, initially valued at $3,896.8 million in 2025, is projected to grow substantially, reaching $10,236.7 million by 2036, with a remarkable compound annual growth rate (CAGR) of 9.24% from 2026 to 2036.
The global medical image analytics market has evolved from a post-processing and visualization-focused software category into a broader clinical decision support and workflow enablement ecosystem. It includes advanced visualization, 2D/3D/4D image analysis, segmentation, registration, fusion, quantitative analysis, computer-aided detection, treatment-planning support, and AI-enabled image interpretation tools. These solutions are increasingly being adopted across radiology, cardiology, oncology, neurology, obstetrics and gynecology, and musculoskeletal imaging to improve diagnostic confidence, streamline clinical workflows, and support more objective and reproducible image interpretation.
The growth of the global medical image analytics market has been supported by rising imaging procedure volumes, increasing disease burden, shortage of radiologists and imaging specialists, and growing demand for faster and more standardized diagnostic workflows. Hospitals and diagnostic imaging centers are under pressure to manage higher scan volumes while maintaining reporting quality and turnaround times. As a result, image analytics tools have gained importance as workflow-support solutions that help automate repetitive tasks, enhance image assessment, quantify disease progression, and support clinical decision-making.
Overall, the global medical image analytics market is moving toward integrated, scalable, and clinically validated analytics solutions that can support both routine imaging workflows and high-complexity specialty use cases. Adoption is expected to be strongest where solutions demonstrate measurable value in reducing workload, improving diagnostic consistency, supporting earlier disease detection, and enabling quantitative imaging-based care pathways.
Market Introduction
Medical image analytics is becoming an important software layer within the diagnostic imaging ecosystem, enabling healthcare providers to extract more clinical and operational value from acquired imaging data. As hospitals and imaging centers manage rising scan volumes, growing disease burden, and increasing pressure on radiology capacity, demand is expanding for solutions that support image visualization, quantification, post-processing, interpretation support, and treatment-planning workflows.
The global medical image analytics market is gaining momentum as analytics tools become more deeply integrated into imaging modalities, PACS, advanced visualization platforms, enterprise imaging systems, and cloud-based clinical workflows. Adoption is being driven by the need to improve reporting efficiency, diagnostic consistency, disease monitoring, and specialty imaging workflows across radiology, cardiology, oncology, neurology, and other clinical areas. With both established imaging vendors and specialized software companies expanding their portfolios, the global medical image analytics market is expected to shift toward integrated, scalable, and clinically validated solutions that support routine diagnostics as well as advanced image-guided care pathways.
Industrial Impact
The global medical image analytics market is being shaped by a mixed competitive structure that includes large imaging modality vendors, enterprise imaging companies, advanced visualization specialists, AI-native imaging companies, and disease-specific analytics providers. Large healthcare technology companies such as GE HealthCare Technologies Inc., Siemens Healthineers AG, Koninklijke Philips N.V., FUJIFILM Holdings Corporation, and Esaote SPA are strengthening their position by embedding analytics within imaging systems, visualization platforms, procedure-planning tools, and enterprise workflow environments. This is increasing the role of image analytics as a core layer within diagnostic imaging infrastructure rather than a separate post-processing function.
At the same time, specialized companies such as Aidoc, Qure.ai, Lunit Inc., Subtle Medical, Medis Medical Imaging Systems B.V., Circle Cardiovascular Imaging Inc., and Guerbet (Intrasense) are accelerating market development through modality-specific and disease-focused solutions across chest imaging, oncology, neurology, cardiology, breast imaging, MRI enhancement, and advanced visualization. Their strategies include regulatory clearances, hospital and imaging-network partnerships, product upgrades, platform integrations, and regional expansion. These developments are intensifying competition, expanding clinical use cases, and pushing the market toward more integrated, workflow-oriented, and clinically validated image analytics solutions.
Market Segmentation:
Segmentation 1: By Product Type
• Standalone Software
• Integrated Software
Integrated Software Segment to Dominate the Global Medical Image Analytics Market (by Product Type)
In 2025, on the basis of product type, integrated software accounted for the largest share of the global medical image analytics market. Healthcare providers increasingly prefer analytics tools embedded within PACS, enterprise imaging platforms, advanced visualization systems, and modality vendor ecosystems, as these reduce workflow disruption and support faster clinical adoption. Integrated solutions also offer stronger interoperability, easier access to prior images, and smoother use across radiology reporting and treatment-planning workflows. Standalone software remains relevant for specialized use cases, although adoption is comparatively more selective due to integration and workflow-deployment requirements.
Segmentation 2: By Imaging Type
• 2D Imaging
• 3D Imaging
• 4D Imaging
3D Segment to Dominate the Global Medical Image Analytics Market (by Imaging Type)
In 2025, on the basis of imaging type, 3D imaging accounted for the largest share of the medical image analytics market. It has broad clinical utility across CT, MRI, ultrasound, cardiology, oncology, neurology, and surgical/treatment-planning workflows, where volumetric visualization, segmentation, fusion, and quantitative assessment are critical. Compared with 2D imaging, 3D analytics offers higher-value clinical interpretation and procedure-planning support, while 4D imaging remains more specialized and comparatively limited to select dynamic imaging.
Segmentation 3: By Imaging Modality
• X-Ray
• Ultrasound
• Magnetic Resonance Imaging
• Computed Tomography
• Others
Computed Tomography Segment to Dominate the Global Medical Image Analytics Market (by Imaging Modality)
In 2025, on the basis of imaging modality, computed tomography accounted for the largest share of the medical image analytics market. CT generates high-volume, high-complexity image datasets that require advanced visualization, 3D reconstruction, segmentation, lesion detection, vessel analysis, and quantitative assessment. Its strong use across oncology, cardiology, neurology, emergency care, and surgical planning creates broad demand for analytics software. X-ray has a higher procedure volume, although CT typically drives greater analytics value per study due to richer image complexity and wider use in advanced clinical decision-making.
Segmentation 4: By Application
• Cardiology
• Oncology
• Neurology
• Obstetrics and Gynecology
• Orthopedics
• Other Applications
Oncology Segment to Dominate the Global Medical Image Analytics Market (by Application)
In 2025, on the basis of application, oncology accounted for the largest share of the medical image analytics market. The segment has strong demand for lesion detection, tumor segmentation, staging, treatment-planning support, response assessment, and longitudinal disease monitoring across CT, MRI, PET/CT, ultrasound, and X-ray workflows. Rising cancer screening volumes and the growing use of quantitative imaging in precision oncology further increase the need for analytics tools. Cardiology remains a major application area, while oncology offers broader cross-modality usage and a higher need for continuous image-based assessment.
Segmentation 5: By End User
• Hospitals
• Diagnostics Imaging Centers
• Other End Users
Hospitals Segment to Dominate the Medical Image Analytics Market (by End User)
In 2025, on the basis of end user, hospitals account for the largest share of the medical image analytics market. They handle the highest volume and complexity of imaging cases across emergency care, oncology, cardiology, neurology, orthopedics, and surgical planning, creating broad demand for advanced analytics. Hospitals also have stronger budgets, integrated PACS/enterprise imaging infrastructure, and a greater need for workflow optimization across multiple departments. Diagnostic imaging centers remain important, although their adoption is comparatively more concentrated around high-throughput outpatient imaging and screening workflows.
Segmentation 6: By Region
• North America
o U.S.
o Canada
• Europe
o U.K.
o Germany
o France
o Italy
o Spain
o Rest-of-Europe
• Asia-Pacific
o China
o Japan
o India
o South Korea
o Australia and New Zealand
o Rest-of-Asia-Pacific
• Latin America
o Brazil
o Mexico
o Rest-of-Latin America
• Middle East and Africa
North America to Dominate the Medical Image Analytics Market (by Region)
In 2025, North America accounted for the largest share of the global medical image analytics market. The region benefits from high imaging procedure volumes, strong adoption of advanced visualization and AI-enabled analytics, mature hospital IT infrastructure, and early regulatory clearance of imaging software solutions. The U.S. also has a high concentration of leading vendors, active clinical AI deployment across large health systems, and stronger purchasing capacity among hospitals and imaging networks. These factors make North America the most commercially mature and scalable market for medical image analytics solutions.
Recent Developments in the Medical Image Analytics Market
• In May 2026, Pie Medical Imaging expanded its Utrecht office by 50% to support the growing team behind its structural heart disease management solutions. The expansion reflected increasing global adoption of the 3mensio product line and reinforced the company’s investment in cardiovascular image analysis, visualization, and procedure-planning innovation.
• In April 2026, Sol Radiology partnered with Aidoc to deploy a suite of FDA-cleared, multi-condition clinical AI solutions across hospitals, outpatient imaging centers, and urgent care facilities in Southern California. The collaboration aimed to improve critical finding prioritization, accelerate communication with referring physicians, and enhance radiology workflow efficiency.
• In February 2026, Qure.ai received U.S. FDA 510(k) Class II clearance for qXR-Detect, its AI-powered chest X-ray CADe solution covering six key regions of interest. The clearance strengthened Qure.ai’s U.S. radiology AI portfolio and supported broader use of AI for early abnormality detection, localization, and clinical workflow support in chest radiography.
Demand – Drivers, Challenges, and Opportunities
Market Drivers:
Rising Disease Burden Driving Higher Demand for Advanced Imaging and Image Analytics: The rising burden of imaging-intensive diseases such as cancer, cardiovascular diseases, stroke, COPD, and neurological disorders is expanding the need for advanced diagnostic imaging and follow-up assessment. As these conditions often require CT, MRI, PET, ultrasound, or X-ray across diagnosis, staging, monitoring, and treatment planning, healthcare systems are facing sustained growth in imaging volumes. This creates a stronger need for image analytics solutions that can improve interpretation efficiency, support earlier detection, reduce reporting burden, and enable more consistent clinical decision-making across high-volume care pathways.
Growing Radiologist Workload and Shortage of Image Interpretation Capacity Driving Adoption of Workflow Automation and Image Analytics: The widening gap between imaging demand and radiologist capacity is shifting image analytics from a value-added tool to an operational necessity. As radiology departments face growing reporting backlogs, rising case complexity, and dependence on outsourcing, providers are likely to prioritize solutions that improve throughput without compromising diagnostic quality. However, the adoption focus will increasingly move from standalone AI algorithms to workflow-integrated analytics that reduce manual effort, support prioritization, and fit seamlessly into existing PACS/RIS environments. Vendors that can demonstrate measurable efficiency gains, lower reporting burden, and smooth clinical integration are expected to see stronger adoption and growth in the foreseeable future.
Existing Installed Base of Digital Imaging Infrastructure Enabling Scalable Adoption of Image Analytics: The existing digital imaging installed base is reducing adoption friction for medical image analytics, as providers can enhance current workflows through software-led upgrades rather than major infrastructure replacement. This makes analytics adoption more scalable and commercially viable across hospitals and diagnostic imaging centers. The ability to integrate outputs such as measurements, segmentations, annotations, and derived images into existing PACS and enterprise imaging environments strengthens routine clinical usability. Vendors offering interoperable, workflow-native solutions are likely to gain stronger traction, as providers increasingly prioritize tools that improve the value of existing imaging assets while minimizing operational disruption.
Market Challenges:
Limited Availability of High-Quality Ground-Truth Data Increasing Algorithm Development and Validation Burden: The scarcity of high-quality ground-truth data creates a structural bottleneck for medical image analytics vendors, particularly in complex applications such as segmentation, contouring, registration, and treatment planning. As performance expectations rise, vendors must invest heavily in expert annotation, quality control, and larger validation datasets, increasing development timelines and commercialization costs. This challenge is likely to be more pronounced in advanced and specialty applications where annotated datasets are harder to generate and standardize. Companies with scalable annotation workflows, strong clinical partnerships, and robust validation infrastructure are better positioned to commercialize reliable image analytics solutions.
Limited Clinical Validation, Generalizability, and Trust in Image Analytics Outputs: The adoption of medical image analytics will depend less on algorithm availability and more on clinical trust in real-world performance. Evidence of performance variability across sites, devices, protocols, and patient groups suggests that providers will remain cautious unless vendors can demonstrate consistent outcomes beyond controlled validation settings. Primary survey feedback further indicates that end users are more comfortable with AI as an assistive layer than as an autonomous decision-maker. As a result, solutions with transparent validation, subgroup-level performance evidence, and clear human-in-the-loop workflows are likely to gain stronger clinical acceptance.
Market Opportunities:
Strategic Partnerships with Hospitals, Radiology Networks, and Imaging Service Providers Creating Scalable Adoption Pathways: Partnership-led commercialization is becoming a practical route for medical image analytics vendors to move from limited deployments to network-level adoption. By aligning with hospitals, imaging chains, and teleradiology providers, vendors can access larger imaging volumes, validate workflow value across diverse settings, and reduce reliance on fragmented direct sales. This model is especially relevant for smaller and mid-sized vendors that need faster market access and stronger clinical credibility. Over time, vendors with scalable partnership models and solutions that fit into multi-site workflows are likely to achieve broader adoption and stronger competitive positioning.
Analyst’s Thoughts
According to Swati Sood, Principal Analyst - BIS Research, “The global medical image analytics market is moving beyond conventional visualization and post-processing toward workflow-integrated analytics that support faster, more consistent, and more quantitative image-based decision-making. As imaging volumes rise and radiology capacity remains constrained, adoption will increasingly depend on clinical validation, interoperability, and measurable workflow value. Vendors that can combine modality-specific depth with seamless integration across PACS, enterprise imaging platforms, and hospital workflows are expected to gain stronger competitive positioning during the forecast period.”
Focus on Product Type, Imaging Type, Imaging Modality, Application, End User, Regional, and Country - Analysis Forecast, 2026-2036
Medical image analytics solutions refer to software-based tools used to process, visualize, analyze, quantify, interpret, and support clinical decision-making from acquired medical images. These solutions are used across imaging modalities such as X-ray, CT, MRI, ultrasound, and other modalities, and enable functions such as 2D/3D/4D post-processing, segmentation, image registration, image fusion, quantitative assessment, computer-aided detection/diagnosis, lesion or anatomy assessment, and treatment-planning support.
Market players are strengthening their position through strategic partnerships with hospitals, imaging networks, medtech companies, and platform providers to expand clinical deployment and workflow integration. They are also pursuing regulatory approvals, product upgrades, and modality-specific launches to improve market access and differentiate their portfolios. In addition, acquisitions, funding rounds, and regional expansion initiatives are helping companies broaden their image analytics capabilities.
The following are the USPs of this report:
• Market regulations and key trends in the medical image analytics market
• Market dynamic analysis of the opportunities, trends, and challenges in the market
This report is valuable for medical imaging system manufacturers, medical image analytics solutions providers, healthcare IT companies, cloud technology providers, enterprise imaging vendors, hospitals, diagnostic imaging centers, teleradiology providers, research institutions, investors, policymakers, and other stakeholders involved in radiology and diagnostic imaging. It will help these organizations understand market trends, competitive dynamics, product opportunities, adoption barriers, and growth potential within the medical image analytics market.
The global AI-enabled imaging modalities market is projected to reach $17,847.6 million by...
The global AI-enabled medical imaging solutions market is projected to reach $18,041.3 million...
The global AI-enabled X-ray imaging systems market is projected to reach $4,761.3 million by...