Published Year: 2019
Latin America Cell Culture Market - Analysis and Forecast, 2018-2025: Focus on Product Types (Consum
The Latin America cell culture market has been witnessing a steady growth. The market is...
Focus on Pricing Analysis, Product, Application, Expression System, and Region - Analysis and Forecast, 2022-2032
Delivery Time: 1-5 Working Days
Get ISO Certified Research, Customization, Data Extraction, and Value-Added Services with All BIS Research Reports
BIS Research provides a comprehensive report library with unlimited access to data, insights, and market intelligence through Subscription.
Get Subscription Know MoreGlobal Recombinant Cell Culture Supplements Market: Industry Overview
The global recombinant cell culture supplements market was estimated at $308.6 million in 2021 and is expected to reach $1,188.6 million by 2032, growing at a CAGR value of 12.24% during the forecast period 2022-2032. The growth in the global recombinant cell culture supplements market is expected to be driven by the rising demand for cell culture supplements, increasing investment in life sciences research and development, as well as growing advantages of recombinant supplements over traditional animal-derived supplements.
Market Lifecycle Stage
The global recombinant cell culture market is increasing at a rapid pace. The growing need for animal-free supplements in cell culture applications is aiding the growth of the recombinant cell culture supplements market. Recombinant cell culture supplements play a crucial role in enhancing cell viability, maintaining a healthy culture, and customizing the cell culture in accordance with the needs of the individual.
Increasing demand for immunotherapy and stem cell and regenerative medicine research is one of the major opportunities in the recombinant cell culture supplements market. Several cell culture companies, and biopharmaceutical companies are working collaboratively on drug development and using recombinant cell culture supplements as a therapeutic means for applications in biological drugs. Furthermore, the market witnessed major mergers and acquisitions in the past four years. For instance, recently, in March 2022, Thermo Fisher Scientific Inc. acquired PeproTech, Inc., a company that specializes in the development and manufacturing of recombinant proteins, in a deal of $1.85 billion.
Figure: Global Recombinant Cell Culture Supplements Market Snapshot
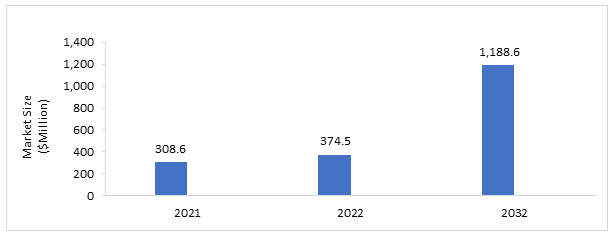
Source: BIS Research Analysis
Impact
Many biopharmaceutical products are being developed by utilizing the cell culture technique. The study of cell physiology and biochemistry is made possible through laboratory cell culture, which also opens up research avenues that are challenging to pursue in vivo. Controlling variables such as the culture media, culture conditions, population density, and growth rate makes it simple to assess the effects of medications or other substances on cultured cells. Additionally, it allows analyzing the function of various genes and offers enormous potential in the field of genetics. It enables the assessment of harmful and carcinogenic chemicals on cells in the fields of oncology and virology and the comprehension of how different medications, viruses, and physical or chemical carcinogens interact. Furthermore, the recombinant cell culture has various applications, such as research on vaccines, stem cells, gene therapy, and genetic engineering, as well as the creation of protein therapies manufacturing of genetically edited proteins such as monoclonal antibodies, insulin, and hormones.
Impact of COVID-19
Due to the pandemic, governments across the globe enforced lockdowns which significantly hampered the research and clinical development of several biopharmaceutical products. Additionally, research grants were shifted toward combating SARS-CoV-2. Further, the biopharmaceutical companies, research, and academic organizations focused on the development of a novel COVID-19 vaccine. Overall, there was some disruption in the recombinant cell culture supplement supply chain and operations in 2020. However, as transportation and marketing were made more accessible, the pandemic's effects on the recombinant cell culture supplements market were minimal to non-existent. Due to the shift in emphasis toward COVID-19 testing, diagnostics, and the supply chain of serum-free or recombinant supplements for the creation of a novel vaccine for the SARS-CoV-2 virus, the companies were able to maintain their financial position.
Market Segmentation
Segmentation 1: by Product
• Recombinant Albumin (rAlbumin)
• Recombinant Insulin (rInsulin)
• Recombinant Epidermal Growth Factor (rEGF)
• Recombinant Interleukin Growth Factor (rILGF)
• Recombinant Transferrin (rTransferrin)
• Recombinant Trypsin (rTrypsin)
• Recombinant Insulin-like Growth Factor (rIGF)
• Recombinant Stem Cell Factor (rSCF)
• Recombinant Aprotinin (rAprotinin)
• Recombinant Lysozyme (rLysozyme)
• Others
The global recombinant cell culture supplements market in the products segment is expected to be dominated by recombinant albumin (rAlbumin). Albumin is the major nutrient and is commonly used in all types of cell cultures. Additionally, albumin is used widely in the development of monoclonal antibodies. The increase in demand for mAbs will further increase the utilization of recombinant albumin supplements in cell culture.
Segmentation 2: by Application
• Stem Cell and Regenerative Medicine
• Bio-Production
• Academic and Research Application
In 2021, the global recombinant cell culture supplements market (by application) was dominated by stem cell and regenerative medicine, with a massive market share of 47.95%. However, the fastest growing segment during the forecast period is found to be academic and research applications due to enhanced cell viability and improved batch-to-batch consistency of end products.
Segmentation 3: by Expression System
• Mammalian
• E. Coli
• Yeast
• Others
The mammalian expression system dominated the global recombinant cell culture supplements market in 2021 with a market share of 40.66%. Most biopharmaceutical companies worldwide utilize stable cell lines derived from mammalian cells to produce biologics.
Segmentation 4: by Region
• North America
• Europe
• Asia-Pacific
• Latin America
• Rest-of-the-World
The global recombinant cell culture supplements market was dominated by North America in 2021. The growth can be attributed to the presence of prominent players in the region as well as the availability of funding and technology for recombinant cell culture supplements in the region.
Recent Developments in the Global Recombinant Cell Culture Supplements Market
• In June 2022, Gemini Bioproducts, LLC collaborated with Avantor, Inc. to provide custom cGMP solutions to enhance the process efficiency of hydrated solutions and cell culture media to biopharmaceutical companies.
• In May 2022, FUJIFILM Irvine Scientific, Inc. announced the completion of its new bioprocessing innovation and collaboration center in China. The new center was to enable local resources and expertise required to optimize cell culture media and workflows to aid the production of vaccines, advanced therapies, and biotherapeutic drug development in China.
• In March 2022, FUJIFILM Irvine Scientific, Inc. acquired Shenandoah Biotechnology, Inc. to further enhance and complement its cell culture solutions and expertise in bioprocessing. Furthermore, the acquisition was to provide access to Shenandoah Biotechnology, Inc.'s large portfolio of recombinant proteins, which includes cytokines and growth factors.
• In December 2019, Sartorius AG acquired a majority stake (~50%) in the Biological Industries and further plans to acquire 20% of the shares within the next three years. This acquisition was to expand Sartorius AG's cell culture media offering and will further complement its existing product portfolio for the companies in a growing market.
Demand – Drivers and Limitations
Following are the demand drivers for the global recombinant cell culture supplements market:
• Increasing Demand for Recombinant Cell Culture Supplements Due to their Advantages
• Increased Funding and Investment in Research and Development for Biopharmaceutical Products in Life Sciences Sector
• Growing Number of Mergers and Acquisitions for Expanding Recombinant Cell Culture Supplements Portfolio
• Push from Regulatory Bodies to Utilize Animal-Free Media Supplements in Cell Culture Process
The market is expected to face some limitations too due to the following challenges:
• Challenging Manufacturing Process of Recombinant Proteins
• Technical Complexities Associated with Recombinant Cell Culture Supplements
Analyst Thoughts
According to Nitish Kumar, Principal Consultant, BIS Research, "The global recombinant cell culture supplements market is an emerging market and is growing rapidly. Due to the growing demand and increasing importance of animal-free cell culture supplements, the focus of researchers and biopharmaceutical companies is now shifting toward serum-free, animal-free, or recombinant cell culture supplements. Many established companies in cell culture media supplements are entering into synergistic activities such as mergers and acquisitions and partnerships and alliances with emerging companies that are solely focused on recombinant cell culture supplements, which would help the market to grow at a faster pace in years to come.”
Focus on Pricing Analysis, Product, Application, Expression System, and Region - Analysis and Forecast, 2022-2032
Recombinant supplements are used in culture media in place of proteins that were previously produced from animals. By isolating certain genes and cloning them into an expression vector, recombinant DNA technology allows for the production of recombinant proteins. These proteins are expressed in cultivated bacteria, yeast, or mammalian cells, among other things, and most of them have human origins. The use of recombinant proteins from mammalian cells in therapies for illnesses like diabetes and cancer has changed the face of healthcare.
The global recombinant cell culture supplements market has seen major development by key players operating in the market, such as business expansions, product launches and developments, partnerships and alliances, mergers and acquisitions, funding activities, and accreditations. According to BIS Research, business expansions and product launches and developments constitute the dominant 'contributors' strategies to further increase their growth in the global recombinant cell culture supplements market companies such as FUJIFILM Irvine Scientific, Inc., Sartorius AG, Merck KGaA, Thermo Fisher Scientific Inc. and Abcam plc. have majorly adopted business expansions, product launches and developments, and mergers and acquisitions as their key strategies.
A new entrant can focus on developing animal-free or serum-free recombinant cell culture supplements as many established companies are focusing on the recombinant supplements as key products to be used in cell culture application.
The following can be seen as some of the USPs of the report:
· Extensive competitive benchmarking of the top 16 players has offered a holistic view of the global recombinant cell culture supplements market
· Market ranking analysis based on product portfolio, recent developments, and regional spread
· Investment landscape including product adoption scenario, funding, and patent analysis
Recombinant cell culture supplement providers, pharmaceutical companies, research, academic institutions, etc. should buy this report.
The Latin America cell culture market has been witnessing a steady growth. The market is...