Published Year: 2020
Global Water and Wastewater Treatment Chemicals Market - Analysis and Forecast, 2019-2029: Focus on
The water and wastewater treatment chemicals industry analysis by BIS Research projects the...
Focus on End User, Chemical Type, Base Material Type, Treatment Method, and Region - Analysis and Forecast, 2022-2031
Delivery Time: 1-5 Working Days
Get ISO Certified Research, Customization, Data Extraction, and Value-Added Services with All BIS Research Reports
BIS Research provides a comprehensive report library with unlimited access to data, insights, and market intelligence through Subscription.
Get Subscription Know More|
Surface Treatment Chemicals Market |
|||
|
Base Year |
2021 |
Market Size in 2021 |
$5,623.3 Million |
|
Forecast Period |
2022-2031 |
Value Projection and Estimation by 2031 |
$11,889.2 Million |
|
CAGR During Forecast Period |
8.0% |
Number of Tables |
112 |
|
Number of Pages |
287 |
Number of Figures |
16 |
Key Market Players and Competition Synopsis
The companies that are profiled have been selected based on inputs gathered from primary experts, analyzing company coverage, product portfolio, and market penetration.
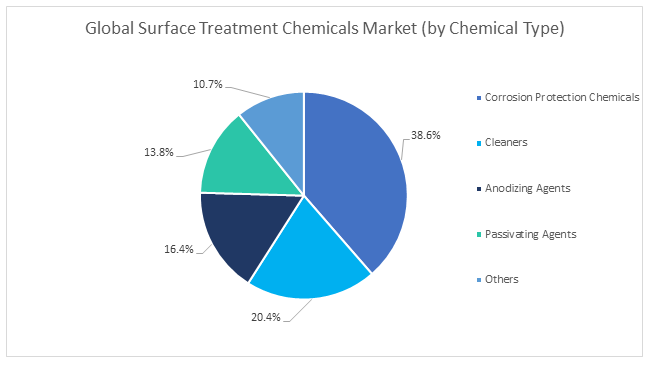
The global surface treatment chemicals market has been segmented by different chemical types, among which corrosion protection chemicals captured around 38.6% of the market as of 2021. Other chemical types, including cleaners, accounted for around 20.4%, anodizing agents accounted for 16.4%, passivating agents accounted for 13.8%, and other chemical types accounted for 10.7% of the total demand in 2021 in terms of value.
Some of the prominent established names in this market are:
• Henkel AG & Co. KGaA
• Nippon Paint Holdings Co., Ltd.
• OC Oerlikon Management AG
• PPG Industries, Inc.
• Quaker Chemical Corporation
• The Sherwin-Williams Company
• Nihon Parkerizing Co., Ltd.
• ALANOD GmbH & Co. KG
• Bulk Chemicals Inc.
• Chemetall GmbH
• Aalberts Surface Technologies
• NOF CORPORATION
• Atotech
• JCU CORPORATION
• Element Solutions Inc
• Trion Coatings, LLC
• ChemTech Surface Finishing Pvt. Ltd.
• YUKEN Surface Technology, S.A. de C.V.
• IONICS
Global Surface Treatment Chemicals Market: Industry Overview
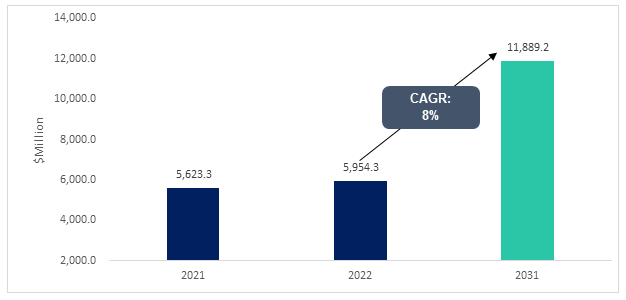
The global surface treatment chemicals market is projected to reach $11,889.2 million by 2031 from $5,623.3 million in 2021, growing at a CAGR of 8.0% during the forecast period 2022-2031.
The demand for surface treatment chemicals is anticipated to grow with the increasing demand from the end-user industries such as automotive, construction, electricals and electronics, aerospace, and others. Furthermore, it is anticipated that during the projected period (2022-2031), the increasing adoption of chemicals in the automotive industry and the expansion of construction projects in several emerging economies, including China, India, and Thailand, are expected to further fuel the advancement of the global surface treatment chemicals market. However, the rigorous environmental standards regarding the emission of hazardous compounds are anticipated to hinder market growth in the upcoming future.
Market Lifecycle Stage
The global surface treatment chemicals market is in the growth phase. Increased investment and research and development activities are expected to boost the market. Furthermore, due to high demand from the end-user industries and rising public concern, government regulations related to hazardous chromium component emissions are expected to increase the demand for eco-sustainable chemicals, thereby bolstering the global surface treatment chemicals market. Moreover, the global surface treatment chemicals market is expected to benefit from the growing implementation of chemicals over etchants, facilitating workflow, which promotes market expansion. The requirement for surface treatment chemicals is being stimulated by heavy machinery advancement as well.
Figure: Global Surface Treatment Chemicals Market, $Million, 2021, 2022, and 2031
Industrial Impact
• Surface treatment chemicals continue to improve the toughness, rust and weathering resistance, aesthetics, and durability of the materials to which they are applied. As a result, these materials are getting prominence in a variety of industries, including automotive, construction, aerospace, and electricals and electronics. One area where implementation has been significantly greater is the automotive industry, which has created opportunities for both existing market participants and market entrants.
• Furthermore, surface treatment chemicals have a moderate to high impact on end-user industries; however, in the upcoming future, with increased production of automotive, aerospace, and other applications, the impact is anticipated to increase.
Impact of COVID-19
COVID-19 had an immediate and significant impact on the global surface treatment chemicals market because of country-wide shutdowns of manufacturing sites, labor shortages, and disruptions in supply and demand chains globally, which distorted the market. The lockdowns imposed by the governments significantly reduced raw material productivity due to a shortage of operations in many regions throughout the world. The automotive, aerospace, and other end-user sectors have been in a slowdown for the last couple of years. The global demand for surface treatment chemicals has been severely impacted by these market downturns in the end-user industries. However, the market is anticipated to recover and is expected to rise gradually over the forecast period.
Market Segmentation:
Segmentation 1: by End User
• Automotive
• Construction
• Aerospace
• Electrical and Electronics
• Coil Industry
• Packaging Industry
• Others
The automotive segment is expected to be the largest among various end users during the forecast period (2022-2031).
Segmentation 2: by Base Material Type
• Metals
• Plastics
• Others
Among different base materials, metals are anticipated to lead the global surface treatment chemicals market during the forecast period (2022-2031).
Segmentation 3: by Chemical Type
• Corrosion Protection Chemicals
• Cleaners
• Anodizing Agents
• Passivating Agents
• Others
Among different chemical types, corrosion protection chemicals are anticipated to lead the market during the forecast period (2022-2031).
Segmentation 4: by Treatment Method
• Electroplating
• Chemical Treatment
• Thermal Spraying
• Hot Dipping
• Others
Among different treatment methods, electroplating is anticipated to lead the global surface treatment chemicals market during the forecast period (2022-2031).
Segmentation 5: by Region
• North America - U.S., Canada, and Mexico
• Europe - Germany, France, Italy, Spain, and Rest-of-Europe
• China
• U.K.
• Asia-Pacific and Japan - Japan, India, South Korea, and Rest-of-Asia-Pacific and Japan
• Middle East and Africa - Saudi Arabia, South Africa, and Rest-of-Middle East and Africa
• South America - Brazil, Argentina, and Rest-of-South America
Asia-Pacific and Japan is expected to lead the global surface treatment chemicals market throughout the forecast period, owing to rapidly increasing automobile demand and a rising prevalence of construction projects across various developing markets.
Recent Developments in the Global Surface Treatment Chemicals Market
• In September 2021, Henkel demonstrated advanced coating technologies for electric vehicle (EV) battery production and aluminum pre-treatment for automobile exteriors at SURCAR 2021. Aluminum’s strong protection against corrosion and thermoelectric conductance greatly enhance reprocessing. Henkel, a pioneer in adhesives, lubricants, and functional coatings for the automobile industry, facilitates a wider utilization of aluminum for enhanced quality, ecology, and operational effectiveness.
• In February 2022, PPG announced the acquisition of Arsonsisi, the powder coatings division. Arsonsisi is a prominent exporter of residential and commercial specialized powder coatings. The acquisition allows PPG to broaden its powder coatings portfolio in Europe, the Middle East, and Africa (EMEA). It also includes metallic bonding, one of the fastest expanding areas for powder coatings that are frequently utilized in specialized treatments for automobile, household, and general industrial uses.
• In October 2021, Aalberts Surface Technologies GmbH announced a complete collaboration with Hoeller Electrolyzer GmbH in the domain of extremely effective electrolyzer surface treatment. The collaboration’s objective was to substantially lower the expense of hydrogen generation while also increasing its accessibility. The extremely effective protracted coatings will be sprayed on in-line machines for massive yields in Lübeck, allowing Hoeller exposure to Europe’s constrained manufacturing capacity.
Demand – Drivers and Limitations
Following are the demand drivers for the global surface treatment chemicals market:
• Rapid Expansion of Several End-Use Industries across Major Regions
• Introduction of Surface Treatment Chemical to Minimize the Impact of Infections
• Increasing Adoption of Plating Process for Metal Industries
The market is expected to face some limitations as well due to the following challenges:
• Rigorous Environmental Standards Regarding the Emission of Hazardous Chromium Components
• Price Volatility of Surface Treatment Chemicals
Analyst Thoughts
According to Sachin Singh, Lead Analyst, BIS Research, “Surface treatment chemicals play a significant role in automotive, construction, electricals and electronics, coil industry, and aerospace, as well as other applications. Surface treatment chemicals have been adopted by these end users because they improve the durability, aesthetics, corrosion and weathering resistance, and longevity of the substrates to which they are applied. Also, the expansion of the automotive industry, increasing construction projects, and demand from heavy machinery are anticipated to drive market growth over the forecast period.”
Focus on End User, Chemical Type, Base Material Type, Treatment Method, and Region - Analysis and Forecast, 2022-2031
Surface treatment chemicals are a group of chemicals, which are used in a procedure to modify the surface of a material (metal, polymer, or wood), making it more receptive to inks, paints, lacquers, adhesives, and other treatments, or more resistant to weather or chemical attacks. The most significant benefit of surface treatment chemicals is that they enhance the longevity of metal equipment, making it a more cost-effective and environmentally friendly alternative. As surface treatments are extremely resilient, they are getting prominence in a variety of industries, including automotive, construction, packaging, aerospace, and others.
Increasing development of eco-sustainable chemical conversion treatments favors the increased utilization of surface treatment chemicals as compared to regular chemicals. Moreover, the developments of eco-friendly chemical conversion treatment chemicals for various industries by key companies such as Chemetall GMbH and others are broadening growth prospects for the global surface treatment chemicals market.
Surface treatment chemicals have seen major developments by key players operating in the market, such as business expansions, partnerships, collaborations, and joint ventures. According to BIS Research analysis, most of the companies preferred partnerships, collaborations, mergers and acquisitions, and joint ventures as a strategy to further increase their growth in the global surface treatment chemicals market. Companies such as Chemetall GMbH, Henkel AG & Co. KgaA, and PPG Industries, Inc. have majorly adopted the strategies such as partnerships, collaborations, and joint ventures.
A new entrant can focus on extracting and providing surface treatment chemicals to end-user sectors such as automotive, aerospace, construction, electricals and electronics, coil industry, and packaging industry due to the high demand and adoption of surface treatment chemicals for these applications worldwide.
The following can be termed as some of the USPs of the report:
• Extensive competitive benchmarking of 20 key players to offer a holistic view of the global surface treatment chemicals market landscape
• Market segregation based on base material type, chemical type, treatment method, and end user
• Investment landscape, including product adoption scenario, funding, and patent analysis
The companies that produce and commercialize surface treatment chemicals, end-user sectors, research institutions, and regulatory bodies involved in the global surface treatment chemicals market should buy this report.
The water and wastewater treatment chemicals industry analysis by BIS Research projects the...