
Published Year: 2019
Global OR Visualization Systems Market: Focus on Systems (OR Camera Systems, OR Display Systems, OR
The Global OR Visualization Systems Market Report by BIS Research projects the market to grow...
Focus on Ecosystem, Application (Infrastructure, Commercial Residential, Industrial, Institutional, Others), and Region - Analysis and Forecast, 2020-2025
Delivery Time: 1-5 Working Days
Get ISO Certified Research, Customization, Data Extraction, and Value-Added Services with All BIS Research Reports
BIS Research provides a comprehensive report library with unlimited access to data, insights, and market intelligence through Subscription.
Get Subscription Know MoreMarket Overview and Estimation
The video surveillance technologies have significantly changed the overall surveillance industry in terms of providing increased safety, cost-effectiveness, and convenience. The video surveillance industry is expected to go through a metamorphic phase involving an unprecedented period of innovation and disruption.
The video surveillance market is expanding significantly and is expected to reach a substantial level by 2025. The video surveillance industry is more than 30 years old, with the last two decades experiencing technological advancements from analog closed-circuit television (CCTV) to digital network video surveillance systems.
Advanced video surveillance systems are easy to install and maintain, provide remote monitoring capabilities, and offer longer retention for recorded video footage with consistency in image and video quality. According to BIS Research analysis, the digital universe is expected to double every three years and is expected to reach 40 trillion gigabytes. Thus, to handle such a large amount of data, new technologies will be required to integrate into video surveillance systems for efficient operations.
The surveillance industry is anticipated to grow at a robust rate due to the introduction of video content analytics (VCA) and video surveillance as a service (VSaaS). VCA facilitates the effective extraction of structured information through automatic analysis of the data stream or the images from the closed-circuit television (CCTV). The recognition software includes facial recognition and automatic number plate recognition systems, which are explicitly used for identifying people and vehicles, respectively.
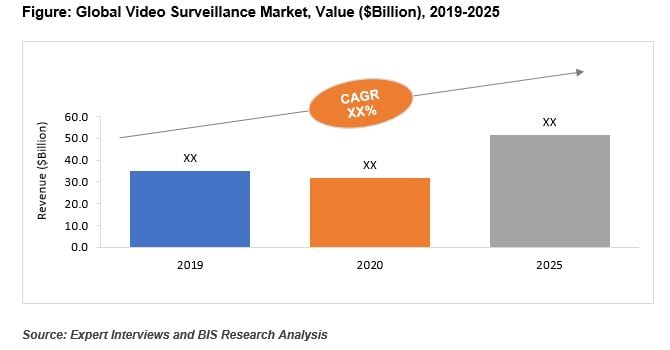
According to market intelligence report published by BIS Research, the global video surveillance market was valued at $35.05 billion in 2019 and is expected to grow at CAGR of 10.06% during the forecast period 2020-2025.
|
Growth Drivers |
• Increase Adoption of Surveillance Systems to monitor COVID-19 cases • Increasing Smart Cities and Megaprojects Globally • Increasing Government Initiatives to Improve Public Safety • Adoption of Video Surveillance Systems in Educational Institutes • Adoption of IP Cameras to Support Internet of Things (IoT) • Development of System on Chips (SoC) Improving Processing Speed |
||
|
Market Challenges |
• Absence of Large Bandwidth and Storage Network Connection • Threat to Data Integrity • Burden of Data Storage for Government Agencies |
||
|
Market Opportunities |
• Integration of Artificial Intelligence and Deep Learning in Video Surveillance • Increasing Demand for VSaaS and VCA • Increasing Demand for Intelligent Transportation System • Increase Adoption of Video Surveillance Drones and Body-Worn Cameras • Development of Semiconductors for Video Surveillance Systems |
||
Growth Factors
Increase Adoption of Surveillance Systems to monitor COVID-19 cases
The increase in the budget for procuring advanced video surveillance systems by various countries including the U.S., India, Russia, Israel, China, Singapore, South Korea, and among others, for procuring technically advanced video surveillance systems to track the individuals’ quarantine activity is playing a major role in strengthening the market growth.
Increasing Smart Cities and Megaprojects Globally
Implementation of various smart cities and megaprojects is not limited to the U.S. only but is also expanding in all corners of the world including China, Brazil, India, the Middle East countries, and other developing economies. Thus, the growing critical infrastructure, along with the requirement of upgrading the existing security structure, acts as a major driver for the video surveillance market.
Increasing Government Initiatives to Improve Public Safety
The governments worldwide are actively participating in the deployment of video surveillance systems, especially with advancements such as facial recognition, human rights, track criminals, and object detection in the field of video analytics technologies. The video surveillance services have become a much more valuable resource for law enforcement authorities for ensuring public safety.
Adoption of Video Surveillance Systems in Educational Institutes
Stringent regulations posed by various governments to install video surveillance systems in educational institutes is expected to propel the market growth. Further, the U.S. higher educational institutes have also planned to propose body-warn cameras and other video surveillance units due to the growing campus shootings.
Focus on Ecosystem, Application (Infrastructure, Commercial Residential, Industrial, Institutional, Others), and Region - Analysis and Forecast, 2020-2025
The Global OR Visualization Systems Market Report by BIS Research projects the market to grow...

The video surveillance market generated a revenue of $32.00 billion in 2017, and is expected...

The global in-vehicle infotainment market was worth $33.78 billion in the FY2016 and is...
The report provides a comprehensive market analysis and forecast along with the recent trends...