Published Year: 2023
Next-Generation IVD (In vitro diagnostics) Market - A Global and Regional Analysis: Focus on Product
The next-generation IVD market was valued at $86.21 billion in 2022 and is expected to reach...
Focus on Product, Test Type, Application, End User, Region and Competitive Landscape - Analysis and Forecast, 2020-2030
Delivery Time: 1-5 Working Days
Get ISO Certified Research, Customization, Data Extraction, and Value-Added Services with All BIS Research Reports
BIS Research provides a comprehensive report library with unlimited access to data, insights, and market intelligence through Subscription.
Get Subscription Know More
1.1 Inclusion and Exclusion
2.1 Scope of the Study
2.2 Key Questions Answered in the Report
3.1 Global IVD Market: Research Methodology
3.2 Primary Data Sources
3.3 Secondary data sources
3.4 Market Estimation Model
3.5 Criteria for Company Profiling
4.1 Introduction
4.2 Global IVD Market Outlook
4.2.1 Global Diagnostic Expenditures
4.2.2 Pricing Patterns for Diagnostics (IVD)
4.3 Reimbursement Scenario
4.3.1 U.S.
4.3.2 Europe
4.4 Regulatory Scenario
4.4.1 U.S.
4.4.2 Europe
4.4.3 Asia-Pacific
4.4.4 Latin America
4.5 Market Size and Growth Potential
4.5.1 Short Term Impact (2020-2025)
4.5.2 Long Term Impact (2026-2030)
5.1 Situation Analysis
5.2 Impact of COVID-19 on IVD Testing
6.1 Market Drivers
6.1.1 Rise in Adoption of Rapid, Minimally Invasive and Non-Invasive Diagnostics Tools & Techniques
6.1.2 Rise in the Global Geriatric Population
6.1.3 High Number of Patients with Infectious and Chronic Diseases
6.1.4 Rise in the Global Healthcare Expenditure
6.1.5 Rise in the Demand for POC Testing
6.2 Market Restraints
6.2.1 Uneven Reimbursement Scenario
6.2.2 Uncertain Regulatory Environment
6.3 Market Opportunities
6.3.1 Rise in the Demand for Molecular Diagnostics
6.3.2 Epigenomics-Based Approach
7.1 Overview
7.2 Instruments
7.3 Consumables
7.3.1 Kits
7.3.2 Reagents
7.4 Software
8.1 Overview
8.2 Immunoassay
8.3 Clinical Chemistry
8.4 Whole Blood Glucose Monitoring
8.5 Molecular Diagnostics
8.6 Microbiology
8.7 Anatomic Pathology
8.8 Hematology
8.9 Coagulation
8.10 Critical Care
8.11 Urinalysis
8.12 Others
9.1 Overview
9.2 Diabetes
9.3 Infectious Disease
9.4 Oncology/Cancer
9.5 Cardiology
9.6 Nephrology
9.7 Autoimmune Disease
9.8 Drug Testing/Pharmacogenomics
9.9 HIV/AIDS
9.10 Women’s Health
9.11 Other Applications
10.1 Overview
10.2 Hospitals
10.3 Central Laboratories
10.4 Point-of-Care (POC)
10.5 Clinics
10.6 Academic Institutions
10.7 Other End Users
11.1 North America
11.1.1 North America IVD Market (by Test Type)
11.1.2 U.S.
11.1.3 Canada
11.2 Europe
11.2.1 Europe IVD Market (by Test Type)
11.2.2 Germany
11.2.3 U.K.
11.2.4 France
11.2.5 Italy
11.2.6 Spain
11.2.7 Netherlands
11.2.8 Rest-of-Europe
11.3 Asia-Pacific
11.3.1 Asia-Pacific IVD Market (by Test Type)
11.3.2 Japan
11.3.3 China
11.3.4 India
11.3.5 South Korea
11.3.6 Australia
11.3.7 Rest-of-Asia-Pacific
11.4 Latin America
11.4.1 LATAM IVD Market (by Test Type)
11.4.2 Brazil
11.4.3 Mexico
11.4.4 Rest-of-Latin-America
11.5 Middle East
11.5.1 Middle East IVD Market (by Test Type)
11.5.2 Saudi Arabia
11.5.3 Israel
11.5.4 Rest-of-Middle East
11.6 Rest-of-the-World
11.6.1 RoW IVD Market (by Test Type)
12.1 Key Takeaways
12.2 Gap Analysis
12.3 Key Factors Influencing Decision Making in the IVD Market
12.4 Technology Preferences
13.1 Key Strategies and Development
13.1.1 Product Launch and Enhancements
13.1.2 Approvals
13.1.3 Synergistic Activities
13.1.4 Acquisitions
13.1.5 Expansions
13.2 Market Share Analysis
13.3 Growth Share Analysis (Opportunity Mapping)
14.1 Overview
14.2 Agilent Technologies, Inc.
14.2.1 Company Overview
14.2.2 Role of Agilent Technologies, Inc. in the Global IVD Market
14.2.3 Financials
14.2.4 Key Insights About Financial Health of the Company
14.2.5 SWOT Analysis
14.3 F. Hoffmann-La Roche
14.3.1 Company Overview
14.3.2 Role of F. Hoffmann-La Roche AG in the Global IVD Market
14.3.3 Financials
14.3.4 Key Insights About Financial Health of the Company
14.3.5 SWOT Analysis
14.4 Illumina, Inc.
14.4.1 Company Overview
14.4.2 Role of Illumina, Inc. in the Global IVD Market
14.4.3 Financials
14.4.4 Key Insights About Financial Health of the Company
14.4.5 SWOT Analysis
14.5 Qiagen N.V.
14.5.1 Company Overview
14.5.2 Role of QIAGEN N.V. plc in the Global IVD Market
14.5.3 Financials
14.5.4 Key Insights About Financial Health of the Company
14.5.5 SWOT Analysis
14.6 Abbott Laboratories, Inc.
14.6.1 Company Overview
14.6.2 Role of Abbott Laboratories in the Global IVD Market
14.6.3 Financials
14.6.4 Key Insights About Financial Health of the Company
14.6.5 SWOT Analysis
14.7 Thermo Fisher Scientific
14.7.1 Company Overview
14.7.2 Role of Thermo Fisher Scientific in the Global IVD Market
14.7.3 Financials
14.7.4 Key Insights About Financial Health of the Company
14.7.5 SWOT Analysis
14.8 Danaher Corporation
14.8.1 Company Overview
14.8.2 Role of Danaher Corporation in the Global IVD Market
14.8.3 Financials
14.8.4 Key Insights About Financial Health of the Company
14.8.5 SWOT Analysis
14.9 Myriad Genetics, Inc.
14.9.1 Company Overview
14.9.2 Role of Myriad Genetics, Inc. in the Global IVD Market
14.9.3 Financials
14.9.4 Key Insights About Financial Health of the Company
14.9.5 SWOT Analysis
14.10 Laboratory Corporation of America Holdings
14.10.1 Company Overview
14.10.2 Role of Laboratory Corporation of America Holdings in the Global IVD Market
14.10.3 Financials
14.10.4 SWOT Analysis
14.11 Siemens Healthineers, Inc.
14.11.1 Company Overview
14.11.2 Role of Siemens Healthineers, Inc. in the Global IVD Market
14.11.3 Financials
14.11.4 Key Insights About Financial Health of the Company
14.11.5 SWOT Analysis
14.12 Quest Diagnostics Incorporated
14.12.1 Company Overview
14.12.2 Role of Quest Diagnostics Incorporated in the Global IVD Market
14.12.3 Financials
14.12.4 SWOT Analysis
14.13 Bio-Rad Laboratories, Inc.
14.13.1 Company Overview
14.13.2 Role of Bio-Rad Laboratories, Inc. in the Global IVD Market
14.13.3 Financials
14.13.4 Key Insights About Financial Health of the Company
14.13.5 SWOT Analysis
14.14 Sysmex Corporation
14.14.1 Company Overview
14.14.2 Role of Sysmex Corporation in the Global IVD Market
14.14.3 Financials
14.14.4 Key Insights About Financial Health of the Company
14.14.5 SWOT Analysis
14.15 Biomérieux SA
14.15.1 Company Overview
14.15.2 Role of bioMérieux S.A. in the Global IVD Market
14.15.3 Financials
14.15.4 Key Insights About Financial Health of the Company
14.15.5 SWOT Analysis
14.16 Becton, Dickinson and Company
14.16.1 Company Overview
14.16.2 Role of Becton, Dickinson and Company in the Global IVD Market
14.16.3 Financials
14.16.4 Key Insights About Financial Health of the Company
14.16.5 SWOT Analysis
14.17 Ortho Clinical Diagnostics
14.17.1 Company Overview
14.17.2 Role of Ortho Clinical Diagnostics in the Global IVD Market
14.17.3 SWOT Analysis
14.18 Hologic, Inc.
14.18.1 Company Overview
14.18.2 Role of Hologic, Inc. in the Global IVD Market
14.18.3 Financials
14.18.4 Key Insights About Financial Health of the Company
14.18.5 SWOT Analysis
14.19 DiaSorin S.p.A
14.19.1 Company Overview
14.19.2 Role of DiaSorin S.p.A. in the Global IVD Market
14.19.3 Financials
14.19.4 Key Insights About Financial Health of the Company
14.19.5 SWOT Analysis
14.20 Transasia Bio-Medicals Ltd.
14.20.1 Company Overview
14.20.2 Role of Transasia Bio-Medicals Ltd. in the Global IVD Market
14.20.3 SWOT Analysis
Table 4.1: European Medical Device and IVD Payment Schemes
Table 5.1: COVID-19 Related Product Offering by Major Players
Table 5.2: Impact of COVID-19 on Different Countries
Table 7.1: Key Automated IVD Instruments
Table 8.1: Key IVD Immunoassay Solutions
Table 8.2: Key IVD Clinical Chemistry Solutions
Table 8.3: Key IVD Whole Blood Glucose Monitoring Solutions
Table 11.1: North America IVD Market (by Test Type), $Million, 2019-2030
Table 11.2: Europe IVD Market (by Test Type), $Million, 2019-2030
Table 11.3: Asia-Pacific IVD Market (by Test Type), $Million, 2019-2030
Table 11.4: LATAM IVD Market (by Test Type), $Million, 2019-2030
Table 11.5: Middle East IVD Market (by Test Type), $Million, 2019-2030
Table 11.6: RoW IVD Market (by Test Type), $Million, 2019-2030
Table 12.1: Major Issues in Research Laboratories in the Asia-Pacific Region
Figure 1: Impact Analysis on the Global IVD Market
Figure 2: Global IVD Market (by Product), $Million, 2020 vs. 2030
Figure 3: Global IVD Market (by Test Type), $Million, 2020 vs. 2030
Figure 4: Global IVD Market (by Application), $Million, 2020 vs. 2030
Figure 5: Global IVD Market (by End User), $Million, 2020 vs. 2030
Figure 6: Global IVD Market Snapshot (by Region)
Figure 2.1: Global IVD Market Segmentation
Figure 3.1: Global IVD Market Methodology
Figure 3.2: Primary Research Methodology
Figure 3.3: Top-Down Approach (Segment-Wise Analysis)
Figure 3.4: Bottom-up Approach (Segment-Wise Analysis)
Figure 4.1: Global IVD Market, 2019-2030
Figure 5.1: Global IVD Market, Pre- vs. Post-COVID-19
Figure 6.1: Global IVD Market: Market Dynamics
Figure 7.1: Global IVD Market, (by Product), $Million, 2020 vs. 2030
Figure 7.2: IVD Instrument Market, $Million, 2019-2030
Figure 7.3: IVD Consumables Market, $Million, 2019-2030
Figure 7.4: IVD Kits Market, $Million, 2019-2030
Figure 7.5: IVD Reagents Market, $Million, 2019-2030
Figure 7.6: IVD Software Market, $Million, 2019-2030
Figure 8.1: Global IVD Market (by Test Type), $Million, 2020 vs. 2030
Figure 8.2: IVD Immunoassay Market, $Million, 2019-2030
Figure 8.3: IVD Clinical Chemistry Market, $Million, 2019-2030
Figure 8.4: IVD Whole Blood Glucose Monitoring Market, $Million, 2019-2030
Figure 8.5: IVD Molecular Diagnostics Market, $Million, 2019-2030
Figure 8.6: IVD Microbiology Market, $Million, 2019-2030
Figure 8.7: IVD Anatomic Pathology Market, $Million, 2019-2030
Figure 8.8: IVD Hematology Market, $Million, 2019-2030
Figure 8.9: IVD Coagulation Market, $Million, 2019-2030
Figure 8.10: IVD Critical Care Market, $Million, 2019-2030
Figure 8.11: IVD Urinalysis Market, $Million, 2019-2030
Figure 8.12: IVD Other Test Type Market, $Million, 2019-2030
Figure 9.1: Global IVD Market (by Application), $Million, 2020 vs. 2030
Figure 9.2: IVD Market for Diabetes, $Million, 2019-2030
Figure 9.3: IVD Market for Infectious Disease, $Million, 2019-2030
Figure 9.4: IVD Market for Oncology/Cancer, $Million, 2019-2030
Figure 9.5: IVD Market for Cardiology, $Million, 2019-2030
Figure 9.6: IVD Market for Nephrology, $Million, 2019-2030
Figure 9.7: IVD Market for Autoimmune Disease, $Million, 2019-2030
Figure 9.8: IVD Market for Drug Testing/Pharmacogenomics, $Million, 2019-2030
Figure 9.9: IVD Market for HIV/AIDS, $Million, 2019-2030
Figure 9.10: IVD Market for Women Health, $Million, 2019-2030
Figure 9.11: IVD Market for Other Applications, $Million, 2019-2030
Figure 10.1: Global IVD Market (by End User), $Million, 2020 vs. 2030
Figure 10.2: IVD Market for Hospitals, $Million, 2019-2030
Figure 10.3: IVD Market for Central Laboratories, $Million, 2019-2030
Figure 10.4: IVD Market for POC, $Million, 2019-2030
Figure 10.5: IVD Market for Clinics, $Million, 2019-2030
Figure 10.6: IVD Market for Academic Institutions, $Million, 2019-2030
Figure 10.7: IVD Market for Other End Users, $Million, 2019-2030
Figure 11.1: Global IVD Market, $Million, 2019-2030
Figure 11.2: North America: Market Dynamics
Figure 11.3: North America IVD Market, $Million, 2019-2030
Figure 11.4: North America IVD Market (by Country), $Million, 2020 vs. 2030
Figure 11.5: U.S. IVD Market, $Million, 2019-2030
Figure 11.6: Canada IVD Market, $Million, 2019-2030
Figure 11.7: Europe: Market Dynamics
Figure 11.8: Europe IVD Market, $Million, 2019-2030
Figure 11.9: Europe IVD Market (by Country), $Million, 2020 vs. 2030
Figure 11.10: Germany IVD Market, $Million, 2019-2030
Figure 11.11: U.K. IVD Market, $Million, 2019-2030
Figure 11.12: France IVD Market, $Million, 2019-2030
Figure 11.13: Italy IVD Market, $Million, 2019-2030
Figure 11.14: Spain IVD Market, $Million, 2019-2030
Figure 11.15: Netherlands IVD Market, $Million, 2019-2030
Figure 11.16: Rest-of-Europe IVD Market, $Million, 2019-2030
Figure 11.17: Asia-Pacific: Market Dynamics
Figure 11.18: Asia-Pacific IVD Market, $Million, 2019-2030
Figure 11.19: Europe IVD Market (by Country), $Million, 2020 vs. 2030
Figure 11.20: Japan IVD Market, $Million, 2019-2030
Figure 11.21: China IVD Market, $Million, 2019-2030
Figure 11.22: India IVD Market, $Million, 2019-2030
Figure 11.23: South Korea IVD Market, $Million, 2019-2030
Figure 11.24: Australia IVD Market, $Million, 2019-2030
Figure 11.25: Rest-of-APAC IVD Market, $Million, 2019-2030
Figure 11.26: Latin America: Market Dynamics
Figure 11.27: Latin America IVD Market, $Million, 2019-2030
Figure 11.28: Latin America IVD Market (by Country), $Million, 2020 vs. 2030
Figure 11.29: Brazil IVD Market, $Million, 2019-2030
Figure 11.30: Mexico IVD Market, $Million, 2019-2030
Figure 11.31: Rest-of-Latin America IVD Market, $Million, 2019-2030
Figure 11.32: Middle East: Market Dynamics
Figure 11.33: Middle East IVD Market, $Million, 2019-2030
Figure 11.34: Middle East IVD Market (by Country), $Million, 2020 vs. 2030
Figure 11.35: Saudi Arabia IVD Market, $Million, 2019-2030
Figure 11.36: Israel IVD Market, $Million, 2019-2030
Figure 11.37: Rest-of-Middle East IVD Market, $Million, 2019-2030
Figure 11.38: Rest of the World IVD Market, $Million, 2019-2030
Figure 13.1: Share of Key Developments and Strategies, January 2017-April 2020
Figure 13.2: Product Launches and Enhancements Share (by Company), January 2017-April 2020
Figure 13.3: Approvals Share (by Company), January 2017-April 2020
Figure 13.4: Synergistic Activities Share (by Company), January 2017-April 2020
Figure 13.5: Acquisition and Merger Share (by Company), January 2017-April 2020
Figure 13.6: Market Share Analysis for the Global IVD Market, 2019
Figure 13.7: Growth Share Matrix for Global IVD Market (by Company)
Figure 14.1: Agilent Technologies, Inc.: Key Product Portfolio
Figure 14.2: Agilent Technologies, Inc.: Overall Financials, 2017-2019
Figure 14.3: Agilent Technologies, Inc.: Revenue (by Segment), 2017-2019
Figure 14.4: Agilent Technologies, Inc.: Revenue (by Region), 2017-2019
Figure 14.5: Agilent Technologies, Inc.: R&D Expenditure, 2017-2019
Figure 14.6: Agilent Technologies, Inc.: SWOT Analysis
Figure 14.7: F. Hoffmann-La Roche AG: Key Product Portfolio
Figure 14.8: F. Hoffmann-La Roche AG: Overall Financials, 2017-2019
Figure 14.9: F. Hoffmann-La Roche AG: Revenue (by Segment), $Million, 2017-2019
Figure 14.10: F. Hoffmann-La Roche AG: Revenue (by Region), 2017-2019
Figure 14.11: F. Hoffmann-La Roche AG: R&D Expenditure, 2017-2019
Figure 14.12: F. Hoffmann-La Roche AG: SWOT Analysis
Figure 14.13: Illumina, Inc.: Key Product Portfolio
Figure 14.14: Illumina, Inc.: Overall Financials, 2017-2019
Figure 14.15: Illumina, Inc.: Revenue (by Segment), 2017-2019
Figure 14.16: Illumina, Inc.: Revenue (by Region), 2017-2019
Figure 14.17: Illumina, Inc.: R&D Expenditure, 2017-2019
Figure 14.18: Illumina, Inc.: SWOT Analysis
Figure 14.19: QIAGEN N.V.: Key Product Portfolio
Figure 14.20: QIAGEN N.V.: Overall Financials, 2017-2019
Figure 14.21: QIAGEN N.V.: Revenue (by Segment), 2017-2019
Figure 14.22: QIAGEN N.V.: Revenue (by Region), 2017-2019
Figure 14.23: QIAGEN N.V.: R&D Expenditure, 2017-2019
Figure 14.24: QIAGEN N.V.: SWOT Analysis
Figure 14.25: Abbott Laboratories: Key Product Offerings
Figure 14.26: Abbott Laboratories: Overall Financials, 2017-2019
Figure 14.27: Abbott Laboratories: Revenue (by Segment), 2017-2019
Figure 14.28: Abbott Laboratories: Revenue Split for Diagnostics, 2017-2019
Figure 14.29: Abbott Laboratories: Revenue (by Region), 2017-2019
Figure 14.30: Abbott Laboratories: R&D Expenditure, 2017-2019
Figure 14.31: Abbott Laboratories: SWOT Analysis
Figure 14.32: Thermo Fisher Scientific Inc.: Key Product Offerings
Figure 14.33: Thermo Fisher Scientific Inc.: Overall Financials, 2017-2019
Figure 14.34: Thermo Fisher Scientific Inc: Sales (by Segment), 2017-2019
Figure 14.35: Thermo Fisher Scientific Inc.: Sales (by Region), 2017-2019
Figure 14.36: Thermo Fisher Scientific Inc.: R&D Expenditure, 2017-2019
Figure 14.37: Thermo Fisher Scientific Inc.: SWOT Analysis
Figure 14.38: Danaher Corporation: Product Portfolio
Figure 14.39: Danaher Corporation: Overall Financials, 2017-2019
Figure 14.40: Danaher Corporation: Revenue (by Business Segment), 2017-2019
Figure 14.41: Danaher Corporation: Revenue (by Region), 2017-2019
Figure 14.42: Danaher Corporation: R&D Expenditure, 2017-2019
Figure 14.43: Danaher Corporation: SWOT Analysis
Figure 14.44: Myriad Genetics, Inc.: Overall Product Portfolio
Figure 14.45: Myriad Genetics, Inc.: Overall Financials, 2017-2019
Figure 14.46: Myriad Genetics, Inc.: Revenue (by Business Segment), 2017-2019
Figure 14.47: Myriad Genetics, Inc.: R&D Expenditure, 2017-2019
Figure 14.48: Myriad Genetics, Inc.: SWOT Analysis
Figure 14.49: Laboratory Corporation of America Holdings: Overall Product Portfolio
Figure 14.50: Laboratory Corporation of America Holdings: Overall Financials, 2017-2019
Figure 14.51: Laboratory Corporation of America Holdings: Revenue (by Segment), 2017-2019
Figure 14.52: Laboratory Corporation of America Holdings: Revenue (by Region), 2018
Figure 14.53: Laboratory Corporation of America Holdings: SWOT Analysis
Figure 14.54: Siemens Healthineers, Inc.: Overall Product Portfolio
Figure 14.55: Siemens Healthineers, Inc.: Overall Financials, 2017-2019
Figure 14.56: Siemens Healthineers, Inc.: Revenue (by Segment), 2017-2019
Figure 14.57: Siemens Healthineers, Inc.: Revenue (by Region), 2017-2019
Figure 14.58: Siemens Healthineers, Inc.: R&D Expenditure, 2017-2019
Figure 14.59: Siemens Healthineers, Inc.: SWOT Analysis
Figure 14.60: Quest Diagnostics Incorporated: Overall Product Portfolio
Figure 14.61: Quest Diagnostics Incorporated: Overall Financials, 2017-2019
Figure 14.62: Quest Diagnostics Incorporated: Revenue (by Business Segment), 2017-2019
Figure 14.63: Quest Diagnostics Incorporated: SWOT Analysis
Figure 14.64: Bio-Rad Laboratories, Inc.: Key Product Portfolio
Figure 14.65: Bio-Rad Laboratories, Inc.: Overall Financials, 2017-2019
Figure 14.66: Bio-Rad Laboratories, Inc.: Revenue (by Segment), 2017-2019
Figure 14.67: Bio-Rad Laboratories, Inc.: Revenue (by Region), 2017-2019
Figure 14.68: Bio-Rad Laboratories, Inc.: R&D Expenditure, 2017-2019
Figure 14.69: Bio-Rad Laboratories, Inc.: SWOT Analysis
Figure 14.70: Sysmex Corporation: Overall Product Portfolio
Figure 14.71: Sysmex Corporation: Overall Financials, 2017-2019
Figure 14.72: Sysmex Corporation: Sales (by Segment), 2017-2019
Figure 14.73: Sysmex Corporation: Sales (by Region), 2017-2019
Figure 14.74: Sysmex Corporation: R&D Expenditure, 2017-2019
Figure 14.75: Sysmex Corporation: SWOT Analysis
Figure 14.76: bioMérieux S.A.: Overall Product Portfolio
Figure 14.77: bioMérieux S.A.: Overall Financials, 2017-2019
Figure 14.78: bioMérieux S.A.: Revenue (by Segment), 2017-2019
Figure 14.79: bioMérieux S.A.: Revenue (by Region), 2017-2019
Figure 14.80: bioMérieux S.A.: R&D Expenditure, 2017-2019
Figure 14.81: bioMérieux S.A.: SWOT Analysis
Figure 14.82: Beckton, Dickinson and Company: Overall Product Portfolio
Figure 14.83: Becton, Dickinson and Company: Overall Financials, 2017-2019
Figure 14.84: Becton, Dickinson and Company: Revenue (by Business Segment), 2017-2019
Figure 14.85: Becton, Dickinson and Company: Revenue (by Region), 2017-2019
Figure 14.86: Becton, Dickinson and Company: R&D Expenditure, 2017-2019
Figure 14.87: Becton, Dickinson and Company: SWOT Analysis
Figure 14.88: Ortho Clinical Diagnostics: Overall Product Portfolio
Figure 14.89: Ortho Clinical Diagnostics: SWOT Analysis
Figure 14.90: Hologic, Inc.: Overall Product Portfolio
Figure 14.91: Hologic, Inc.: Overall Financials, 2017-2019
Figure 14.92: Hologic, Inc.: Revenue (by Segment), 2017-2019
Figure 14.93: Hologic, Inc.: Revenue (by Region), 2017-2019
Figure 14.94: Hologic, Inc.: R&D Expenditure, 2017-2019
Figure 14.95: Hologic, Inc.: SWOT Analysis
Figure 14.96: DiaSorin S.p.A.: Overall Product Portfolio
Figure 14.97: DiaSorin S.p.A.: Overall Financials, 2017-2019
Figure 14.98: DiaSorin S.p.A.: Revenue (by Segment), 2017-2019
Figure 14.99: DiaSorin S.p.A.: by Region, 2017-2019
Figure 14.100: DiaSorin S.p.A: R&D Expenditure, 2017-2019
Figure 14.101: DiaSorin S.p.A: SWOT Analysis
Figure 14.102: Transasia Bio-Medicals Ltd.: Overall Product Portfolio
Figure 14.103: Transasia Bio-Medicals Ltd.: SWOT Analysis
|
Market Report Coverage - In Vitro Diagnostic |
|||
|
Base Year |
2019 |
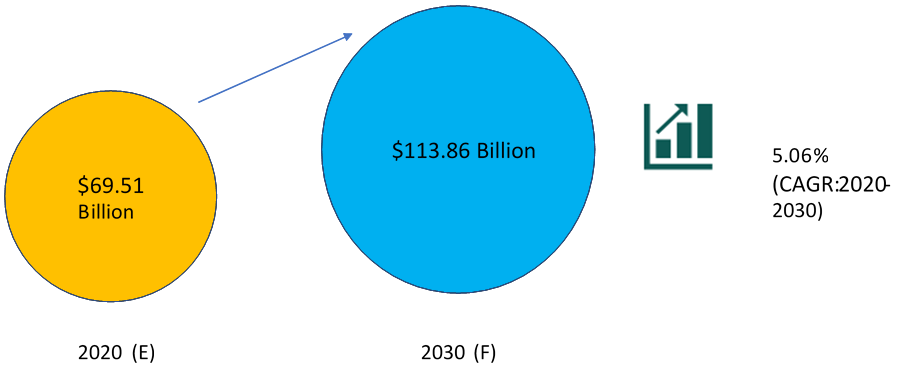
Market Size in 2020 |
$69.51 Billion |
|
Forecast Period |
2020-2030 |
Value Projection and Estimation by 2030 |
$113.86 Billion |
|
CAGR During Forecast Period |
5.06% |
Number of Tables |
14 |
|
Number of Pages |
287 |
Number of Figures |
198 |
|
Research Hours |
240 |
|
|
|
Market Segmentation |
• Product – Instruments, Consumables, and Software • Test Type – Immunoassay, Clinical Chemistry, Whole Blood Glucose Monitoring, Molecular Diagnostics, Microbiology, Anatomic Pathology, Hematology, Coagulation, Critical Care, Urinalysis, and Others • Application- Diabetes, Infectious Disease, Oncology/Cancer, Cardiology, Nephrology, Autoimmune Disease, Drug Testing/Pharmacogenomics, HIV/AIDS, Women Health, and Others • End User – Hospitals, Central Laboratories, Point-of-Care (POC), Clinics, Academic Institutions, and Others |
||
|
Regional Segmentation |
• North America – U.S., Canada • Europe – Germany, U.K., France, Italy, Spain, the Netherlands, and Rest-of-Europe • Asia-Pacific – Japan, China, India, South Korea, Australia, and Rest-of-Asia-Pacific • Latin America – Brazil, Mexico, and Rest-of-Latin America • Middle East – Saudi Arabia, Israel, and Rest-of-Middle East • Rest-of-the-World |
||
|
Growth Drivers |
• Rise in Adoption of Rapid, Minimally Invasive and Non-Invasive Diagnostics Tools & Techniques • Rise in the Global Geriatric Population • High Number of Patients with Infectious and Chronic Diseases • Rise in the Global Healthcare Expenditure • Rise in the Demand for POC Testing |
||
|
Market Challenges |
• Uneven Reimbursement Scenario • Uncertain Regulatory Environment |
||
|
Market Opportunities |
• Rise in the Demand for Molecular Diagnostics • Epigenomics Based Approach |
||
|
Key Companies Profiled |
Agilent Technologies, Inc., F. Hoffmann-La Roche, Illumina, Inc., Qiagen N.V., Abbott Laboratories, Inc., Thermo Fisher Scientific, Danaher Corporation, Myriad Genetics, Inc., Laboratory Corporation of America Holdings, Siemens Healthineers, Inc., Quest Diagnostics Incorporated, Bio-Rad Laboratories, Inc., Sysmex Corporation, bioMérieux S.A. Becton, Dickinson and Company, Ortho Clinical Diagnostics, Hologic, Inc, and DiaSorin S.p.A. |
||
• What are IVD solutions? How have different IVD solutions evolved over the years?
• What are the major market drivers, challenges, and opportunities in the global IVD market?
• What was the global IVD market size in terms of revenue in 2019? How is the market expected to evolve in the upcoming years? What is the market size expected to be in 2030?
• How is each segment of the global IVD market expected to grow during the forecast period between 2020 to 2030, and what is the revenue expected to be generated by each of the segments by the end of 2030?
• What are the developmental strategies implemented by the key players to sustain in the competitive market?
• What is the growth potential of the IVD market in each region, namely, North America, Europe, Asia-Pacific, Latin America, Middle East, and Rest-of-the-World?
• Which product among the two (assays and kits & instrument) are offered by key players such as Thermo Fisher Scientific, Illumina Inc., Qiagen N.V., and F. Hoffmann-La Roche Ltd.?
• Which test type is leading the market in 2019 and expected to dominate the market in 2030, and why?
• Which application and end user type are leading the market in 2019 and are expected to dominate the market in 2030, and why?
• Which region dominated the global IVD market in 2019, and what are the expected trends from each of the regions during the forecast period 2020-2030?
• What are the emerging trends in the global in vitro diagnostic market?
• Which companies are anticipated to be highly disruptive in the future, and why?
Healthcare experts have found IVD industry to be one of the most rapidly evolving markets and the global market for IVD is predicted to grow at a CAGR of 5.06% over the forecast period of 2020-2030. The market is driven by certain factors, which include rise in adoption of rapid, minimally invasive and non-invasive diagnostics tools & techniques, rise in the global geriatric population, high number of patients with infectious and chronic diseases, rise in the global healthcare expenditure, and rise in the demand for POC testing.
Figure: Global In Vitro Diagnostic Market Snapshot
The market is favored by the development of rapid diagnostic instruments and consumables for several clinical areas, such as infectious disease, oncology/cancer, cardiology, HIV/AIDS, and nephrology, among others. Additionally, recent infectious disease outbreaks, such as COVID-19, have further propelled the growth of the global market.
Within the research report, the market is segmented on the basis of product, test type, application, end user, and region. Each of these segments covers the snapshot of the market over the projected years, the inclination of the market revenue, underlying patterns, and trends by using analytics on the primary and secondary data obtained.
Competitive Landscape
The exponential rise in the application of precision medicine on the global level has created a buzz among companies to invest in the development of IVD to increase the accuracy and to ensure shorter turn-around time for disease diagnosis. Due to the diverse product portfolio and intense market penetration, F. Hoffmann-La Roche has been a pioneer in this field and has been a significant competitor in this market.
On the basis of region, North America holds the largest share of the global in vitro diagnostic market due to growing incidence of infectious disease and cancer, including its various types, increased focus on democratizing precision diagnostics for various applications, increasing geriatric population, and favorable government reimbursement policies in the region. Apart from this, the Asia-Pacific region is anticipated to grow at the fastest CAGR during the forecast period.
Focus on Product, Test Type, Application, End User, Region and Competitive Landscape - Analysis and Forecast, 2020-2030
The next-generation IVD market was valued at $86.21 billion in 2022 and is expected to reach...
The global molecular diagnostics market is projected to reach $24,228.0 million by 2031 from...
The global market for infectious disease rapid diagnostics is predicted to grow at a CAGR of...
The global molecular diagnostic point of care industry analysis by BIS Research projects the...
1. Please contact us to discuss customization options, and we can confirm the time and cost (if any). For minor customization requirements that would take 3-5 days, we do not charge any additional amount.
2. All BIS Research reports are delivered to clients via our InsightMonk platform. This allows the customers to extract the data in Excel for their use. Excel is provided for all License types and is not limited to just enterprise users.
3. Additionally, all customers also get access to the following complimentary value-added services from BIS Research.
*Expert Consultation Charges applicable