Figure 1: Global Military Spending, ($Billion), 2017-2019
Figure 2: Market Dynamics of the Military GNSS Anti-Jamming Systems Market
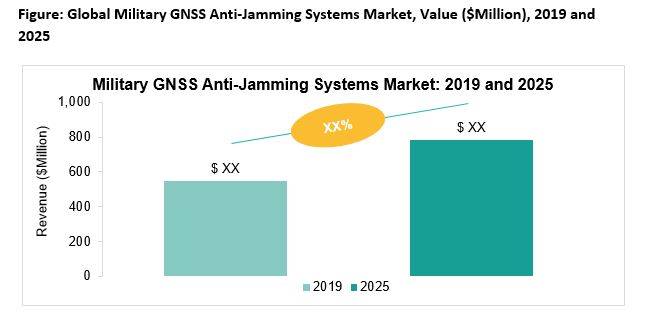
Figure 3: Global Military GNSS Anti-Jamming Systems Market, Value ($Million), 2019 and 2025
Figure 4: Global Military GNSS Anti-Jamming Systems Market, Volume (Thousand Units), 2019 and 2025
Figure 5: Global Military GNSS Anti-Jamming Systems Market (by Component), Share, $Million, 2019 and 2025
Figure 6: Global Military GNSS Anti-Jamming Systems Market (by Element Number), Share,$Million, 2019 and 2025
Figure 7: Global Military GNSS Anti-Jamming Systems Market (by Element Number), Share, Thousand Units, 2019 and 2025
Figure 8: Global Military GNSS Anti-Jamming Systems Market (by Platform), Share, $Million, 2019 and 2025
Figure 9: Global Military GNSS Anti-Jamming Systems Market (by Platform), Share, Thousand Units, 2019 and 2025
Figure 10: Global Military GNSS Anti-Jamming Systems Market (by Region), $Million, 2019
Figure 1.1: Market Dynamics Snapshot
Figure 2.1: Strategies Adopted by Key Market Players
Figure 2.2: Percentage Share of Strategies Adopted by the Market Players, January 2016-March 2020
Figure 2.3: Competitive Benchmarking, 2019
Figure 3.1: Industry Insights
Figure 3.2: GNSS Anti-Jamming Systems: Supply Chain Analysis
Figure 3.3: Global Military GNSS Anti-Jamming Systems Market, Number of Patents Granted, 2016-2019
Figure 3.4: Global Military GNSS Anti-Jamming Systems Market, Patent Analysis (by Country), February 2017- March 2020
Figure 3.5: Average Cost Analysis of Military GNSS Anti-Jamming Systems (by Element Number), 2019
Figure 3.6: COVID-19 Crisis and Defense Markets
Figure 3.7: Impact of COVID-19 on the Global and Regional Defense Industry
Figure 4.1: Global Military GNSS Anti-Jamming Systems Market, Revenue ($Million), 2019-2025
Figure 4.2: Global Military GNSS Anti-Jamming Systems Market, Volume (Thousand Units), 2019-2025
Figure 5.1: Global Military GNSS Anti-Jamming Systems Market (by Component)
Figure 5.2: Global Military GNSS Anti-Jamming Systems Market (by Antenna), Value ($Million), 2019-2025
Figure 5.3: Global Military GNSS Anti-Jamming Systems Market (by Receiver Unit), Value, ($Million), 2019-2025
Figure 6.1: Global Military GNSS Anti-Jamming Systems Market (by Element Number)
Figure 6.2: Global Military GNSS Anti-Jamming Systems Market (by Two-Element), Value ($Million), 2019-2025
Figure 6.3: Global Military GNSS Anti-Jamming Systems Market (by Two-Element), Volume (Thousand Units), 2019-2025
Figure 6.4: Global Military GNSS Anti-Jamming Systems Market (by Four-Element), Value ($Million), 2019-2025
Figure 6.5: Global Military GNSS Anti-Jamming Systems Market (by Four-Element), Volume (Thousand Units), 2019-2025
Figure 6.6: Global Military GNSS Anti-Jamming Systems Market (by Seven/Eight-Element), Value ($Million), 2019-2025
Figure 6.7: Global Military GNSS Anti-Jamming Systems Market (by Seven/Eight-Element), Volume (Thousand Units), 2019-2025
Figure 6.8: Global Military GNSS Anti-Jamming Systems Market (by Twelve/Sixteen-Element), Value ($Million), 2019-2025
Figure 6.9: Global Military GNSS Anti-Jamming Systems Market (by Twelve/Sixteen-Element), Volume (Thousand Units), 2019-2025
Figure 7.1: Global Military GNSS Anti-Jamming Systems Market (by Platform)
Figure 7.2: Global Military GNSS Anti-Jamming Systems Market (by Airborne Platform), Value ($Million), 2019-2025
Figure 7.3: Global Military GNSS Anti-Jamming Systems Market (by Airborne Platform), Volume (Thousand Units), 2019-2025
Figure 7.4: Global Military GNSS Anti-Jamming Systems Market (by Manned Airborne Platform), Value ($Million), 2019-2025
Figure 7.5: Global Military GNSS Anti-Jamming Systems Market (by Manned Airborne Platform), Volume (Thousand Units), 2019-2025
Figure 7.6: Global Military GNSS Anti-Jamming Systems Market (by Unmanned Airborne Platform), Value ($Million), 2019-2025
Figure 7.7: Global Military GNSS Anti-Jamming Systems Market (by Unmanned Airborne Platform), Volume (Thousand Units), 2019-2025
Figure 7.8: Global Military GNSS Anti-Jamming Systems Market (by Ground Platform), Value ($Million), 2019-2025
Figure 7.9: Global Military GNSS Anti-Jamming Systems Market (by Ground Platform), Volume (Thousand Units), 2019-2025
Figure 7.10: Global Military GNSS Anti-Jamming Systems Market (by Manned Ground Platform), Value ($Million), 2019-2025
Figure 7.11: Global Military GNSS Anti-Jamming Systems Market (by Manned Ground Platform), Volume (Thousand Units), 2019-2025
Figure 7.12: Global Military GNSS Anti-Jamming Systems Market (by Unmanned Ground Platform), Value ($Million), 2019-2025
Figure 7.13: Global Military GNSS Anti-Jamming Systems Market (by Unmanned Ground Platform), Volume (Thousand Units), 2019-2025
Figure 7.14: Global Military GNSS Anti-Jamming Systems Market (by Naval Platform), Value ($Million), 2019-2025
Figure 7.15: Global Military GNSS Anti-Jamming Systems Market (by Naval Platform), Volume (Thousand Units), 2019-2025
Figure 7.16: Global Military GNSS Anti-Jamming Systems Market (by Muniition Platform), Value ($Million), 2019-2025
Figure 7.17: Global Military GNSS Anti-Jamming Systems Market (by Munition Platform), Volume (Thousand Units), 2019-2025
Figure 8.1: Global Military GNSS Anti-Jamming Systems Market (by Region)
Figure 8.2: North America Military GNSS anti-jamming Systems Market (by Country), Value ($Million), 2019-2025
Figure 8.3: North America Military GNSS anti-jamming Systems Market (by Country), Volume (Thousand Units), 2019-2025
Figure 8.4: U.S. Defense Budget, 2017-2020 (Requested)
Figure 8.5: U.S. Military GNSS Anti-Jamming Systems Market Size, Value ($Million), 2019-2025
Figure 8.6: U.S. Military GNSS Anti-Jamming Systems Market Size, Volume (Thousand Units), 2019-2025
Figure 8.7: U.S. Military Strength Fleet Size, Volume (Units), 2019
Figure 8.8: Canada Military GNSS Anti-Jamming Systems Market Size, Value ($Million), 2019-2025
Figure 8.9: Canada Military GNSS Anti-Jamming Systems Market Size, Volume (Thousand Units), 2019-2025
Figure 8.10: Europe Military GNSS Anti-Jamming Systems Market (by Country), Value ($Million), 2019-2025
Figure 8.11: Europe Military GNSS Anti-Jamming Systems Market (by Country), Volume (Thousand Units), 2019-2025
Figure 8.12: U.K. Military GNSS Anti-Jamming Systems Market Size, Value ($Million), 2019-2025
Figure 8.13: U.K. Military GNSS Anti-Jamming Systems Market Size, Volume (Thousand Units), 2019-2025
Figure 8.14: Germany Military GNSS Anti-Jamming Systems Market Size, Value ($Million), 2019-2025
Figure 8.15: Germany Military GNSS Anti-Jamming Systems Market Size, Volume (Thousand Units), 2019-2025
Figure 8.16: France Military GNSS Anti-Jamming Systems Market Size, Value ($Million), 2019-2025
Figure 8.17: France Military GNSS Anti-Jamming Systems Market Size, Volume (Thousand Units), 2019-2025
Figure 8.18: Russia Military GNSS Anti-Jamming Systems Market Size, Value ($Million), 2019-2025
Figure 8.19: Russia Military GNSS Anti-Jamming Systems Market Size, Volume (Thousand Units), 2019-2025
Figure 8.20: Rest-of-Europe Military GNSS Anti-Jamming System Market Size, Value ($Million), 2019-2025
Figure 8.21: Rest-of-Europe Military GNSS Anti-Jamming Systems Market Size, Volume (Thousand Units), 2019-2025
Figure 8.22: Asia-Pacific Military GNSS Anti-Jamming Systems Market (by Country), Value ($Million), 2019-2025
Figure 8.23: Asia-Pacific Military GNSS Anti-Jamming Systems Market (by Country), Volume (Thousand Units), 2019-2025
Figure 8.24: China Military GNSS Anti-Jamming Systems Market Size, Value ($Million), 2019-2025
Figure 8.25: China Military GNSS Anti-Jamming Systems Market Size, Volume (Thousand Units), 2019-2025
Figure 8.26: India Military GNSS Anti-Jamming Systems Market Size, Value ($Million), 2019-2025
Figure 8.27: India Military GNSS Anti-Jamming Systems Market Size, Volume (Thousand Units), 2019-2025
Figure 8.28: South Korea Military GNSS Anti-Jamming Systems Market Size, Value ($Million), 2019-2025
Figure 8.29: South Korea Military GNSS Anti-Jamming Systems Market Size, Volume (Thousand Units), 2019-2025
Figure 8.30: Japan Military GNSS Anti-Jamming Systems Market Size, Value ($Million), 2019-2025
Figure 8.31: Japan Military GNSS Anti-Jamming Systems Market Size, Volume (Thousand Units), 2019-2025
Figure 8.32: Rest-of-Asia-Pacific military GNSS Anti-Jamming System Market Size, Value ($Million), 2019-2025
Figure 8.33: Rest-of-Asia-Pacific Military GNSS Anti-Jamming Systems Market Size, Volume (Thousand Units), 2019-2025
Figure 8.34: Rest-of-the-World Military GNSS Anti-Jamming Systems Market (by Region), Value ($Million), 2019-2025
Figure 8.35: Rest-of-the-World Military GNSS Anti-Jamming Systems Market (by Region), Volume (Thousand Units), 2019-2025
Figure 8.36: Middle East Military GNSS Anti-Jamming Systems Market Size, Value ($Million), 2019-2025
Figure 8.37: Middle East Military GNSS Anti-Jamming Systems Market Size, Volume (Thousand Units), 2019-2025
Figure 8.38: Latin America Military GNSS Anti-Jamming Systems Market Size, Value ($Million), 2019-2025
Figure 8.39: Latin America Military GNSS Anti-Jamming Systems Market Size, Volume (Thousand Units), 2019-2025
Figure 9.1: BAE Systems – Product Offerings
Figure 9.2: BAE Systems - Financials, 2017-2019
Figure 9.3: BAE Systems - Business Revenue Mix, 2017-2019
Figure 9.4: BAE Systems - Region Revenue Mix, 2017-2019
Figure 9.5: BAE Systems – Research and Development Expenditure, 2017-2019
Figure 9.6: SWOT Analysis – BAE Systems
Figure 9.7: Boeing – Product Offerings
Figure 9.8: Boeing - Financials, 2017-2019
Figure 9.9: Boeing - Business Revenue Mix, 2017-2019
Figure 9.10: Boeing - Region Revenue Mix, 2017-2019
Figure 9.11: Boeing – Research and Development Expenditure, 2017-2019
Figure 9.12: SWOT Analysis – Boeing
Figure 9.13: Cobham Limited – Product Offerings
Figure 9.14: Chemring Group PLC - Financials, 2017-2019
Figure 9.15: Chemring Group PLC - Business Revenue Mix, 2018-2019
Figure 9.16: Chemring Group PLC - Region Revenue Mix, 2018-2019
Figure 9.17: Chemring Group PLC – Research and Development Expenditure, 2018-2019
Figure 9.18: SWOT Analysis – Chemring Group PLC
Figure 9.19: Curtiss-Wright Corporation – Product Offerings
Figure 9.20: Curtiss-Wright Corporation - Financials, 2017-2019
Figure 9.21: Curtiss-Wright Corporation - Business Revenue Mix, 2017-2019
Figure 9.22: Curtiss-Wright Corporation - Region Revenue Mix, 2017-2019
Figure 9.23: Curtiss-Wright Corporation – Research and Development Expenditure, 2017-2019
Figure 9.24: SWOT Analysis: Curtiss-Wright Corporation
Figure 9.25: Cobham Limited – Product Offerings
Figure 9.26: Cobham Limited - Financials, 2016-2018
Figure 9.27: Cobham Limited - Business Revenue Mix, 2016-2018
Figure 9.28: Cobham Limited - Region Revenue Mix, 2016-2018
Figure 9.29: Cobham Limited – Research and Development Expenditure, 2016-2018
Figure 9.30: SWOT Analysis – Cobham Limited
Figure 9.31: Elbit System Ltd. – Product Offerings
Figure 9.32: Elbit Systems Ltd.- Financials, 2016-2019
Figure 9.33: Elbit Systems - Business Revenue Mix, 2016-2019
Figure 9.34: Elbit Systems Ltd. - Region Revenue Mix, 2017-2019
Figure 9.35: Elbit Systems Ltd. – Research and Development Expenditure, 2017-2019
Figure 9.36: SWOT Analysis – Elbit Systems Ltd.
Figure 9.37: Hertz Systems – Product Offerings
Figure 9.38: Hertz Systems – SWOT Analysis
Figure 9.39: Israel Aerospace Industries Ltd. - Product Offerings
Figure 9.40: Israel Aerospace Industries Ltd. - Financials, 2017-2019
Figure 9.41: SWOT Analysis – Israel Aerospace Industries Ltd.
Figure 9.42: Lockheed Martin Corporation – Product Offerings
Figure 9.43: Lockheed Martin Corporation - Financials, 2017-2019
Figure 9.44: Lockheed Martin Corporation - Business Revenue Mix, 2017-2019
Figure 9.45: Lockheed Martin Corporation - Region Revenue Mix, 2017-2019
Figure 9.46: Lockheed Martin Corporation - Research and Development Expenditure, 2017-2019
Figure 9.47: SWOT Analysis – Lockheed Martin Corporation
Figure 9.48: L3 Harris Technologies Inc – Product Offerings
Figure 9.49: L3 Harris Technologies Inc. - Financials, 2018-2019
Figure 9.50: L3 Harris Technologies Inc. - Business Revenue Mix, 2018-2019
Figure 9.51: L3 Harris Technologies Inc. – SWOT Analysis
Figure 9.52: Mayflower Communication – Product Offerings
Figure 9.53: Mayflower Communication – SWOT Analysis
Figure 9.54: NovAtel Inc – Product Offerings
Figure 9.55: NovAtel Inc. – SWOT Analysis
Figure 9.56: Orolia – Product Offerings
Figure 9.57: Orolia – SWOT Analysis
Figure 9.58: QinetiQ -- Product Offerings
Figure 9.59: QinetiQ – Overall Financials, FY2017-2019
Figure 9.60: QinetiQ – Net Revenue by Business Segment, FY2017-2019
Figure 9.61: QinetiQ – Net Revenue by Region, FY2019
Figure 9.62: QinetiQ Group − SWOT Analysis
Figure 9.63: Raytheon Technologies Corporation – Product Offerings
Figure 9.64: Raytheon Technologies Corporation - Financials, 2017-2019
Figure 9.65: Raytheon Technologies Corporation - Business Revenue Mix, 2017-2019
Figure 9.66: Raytheon Technologies Corporation - Region Revenue Mix, 2019
Figure 9.67: Raytheon Technologies Corporation – Research and Development Expenditure, 2017-2019
Figure 9.68: SWOT Analysis – Raytheon Technologies Corporation
Figure 9.69: Thales Group – Product Offerings
Figure 9.70: Thales Group - Financials, 2017-2019
Figure 9.71: Thales Group - Business Revenue Mix, 2017-2019
Figure 9.72: Thales Group - Region Revenue Mix, 2018-2019
Figure 9.73: Thales Group – Research and Development Expenditure, 2017-2019
Figure 9.74: SWOT Analysis – Thales Group
Figure 10.1: Global Military GNSS Anti-Jamming Systems Market Segmentation
Figure 10.2: Military GNSS Anti-Jamming Systems Market Research Methodology
Figure 10.3: Data Triangulation
Figure 10.4: Top-Down and Bottom-up Approach
Figure 10.5: Global Military GNSS Anti-Jamming Systems Market: Influencing Factors
Figure 10.6: Assumptions and Limitations