A quick peek into the report
Table of Contents
1.1 Industry Ecosystem and Market Structure
1.1.1 Market Ecosystem
1.1.2 Workflow Analysis
1.1.3 Technology Landscape
1.1.4 Adoption Analysis
1.1.5 Challenges and Unmet Needs
1.1.5.1 High Cost of Instruments and Consumables
1.1.5.2 Data Privacy, Interoperability, and Governance Issues
1.2 Market Trends
1.2.1 Impact Analysis
1.2.1.1 Increasing Clinical Integration of Multiomics for Patient Stratification and Treatment Optimization
1.2.1.2 Expansion of AI/ML-Enabled Multi-Analyte Algorithmic Analysis
1.3 Funding Analysis
1.4 Pricing Analysis
1.5 Regulatory Landscape
1.5.1 Regulatory Landscape in North America
1.5.1.1 Regulatory Landscape in the U.S.
1.5.2 Regulatory Landscape in Europe
1.5.2.1 Regulatory Landscape in the EU Countries
1.5.2.2 Regulatory Landscape in the U.K.
1.5.3 Regulatory Landscape in Asia-Pacific
1.5.3.1 Regulatory Landscape in China
1.5.3.2 Regulatory Landscape in Japan
1.6 Market Dynamics
1.6.1 Market Drivers
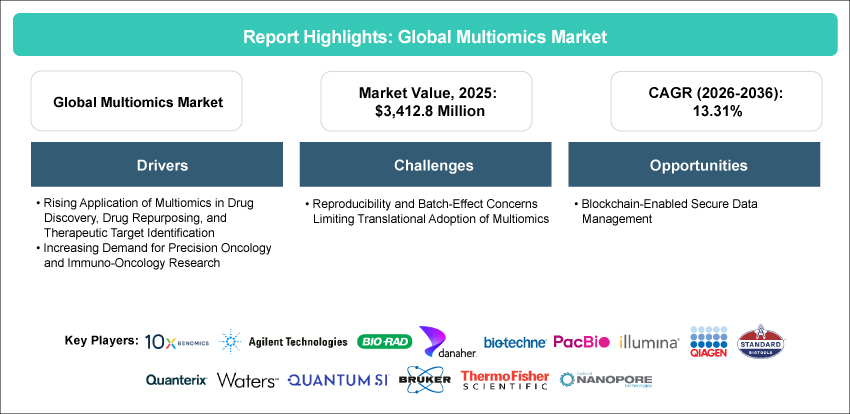
1.6.1.1 Rising Application of Multiomics in Drug Discovery, Drug Repurposing, and Therapeutic Target Identification
1.6.1.2 Increasing Demand for Precision Oncology and Immuno-Oncology Research
1.6.2 Market Restraints
1.6.2.1 Reproducibility and Batch-Effect Concerns Limiting Translational Adoption of Multiomics
1.6.3 Market Opportunities
1.6.3.1 Blockchain-Enabled Secure Data Management
2.1 Consumables and Reagents
2.1.1 Overview
2.1.2 Market Sizing and Forecast
2.1.2.1 Sequencing Consumables and Reagents
2.1.2.2 Mass Spectrometry Consumables and Reagents
2.1.2.3 PCR, Microarray, and Other Molecular Consumables and Reagents
2.1.2.4 Spatial Biology Consumables and Reagents
2.1.2.5 Other Consumables and Reagents
2.2 Instruments
2.2.1 Overview
2.2.2 Market Sizing and Forecast
2.2.2.1 Sequencing Instruments
2.2.2.2 Mass Spectrometers
2.2.2.3 PCR, Microarray, and Other Molecular Instruments
2.2.2.4 Spatial Biology Instruments
2.2.2.5 Other Instruments
2.3 Software
2.3.1 Overview
2.3.2 Market Sizing and Forecast
3.1 Sequencing Technologies
3.1.1 Overview
3.1.2 Market Sizing and Forecast
3.2 Mass Spectrometry Technologies
3.2.1 Overview
3.2.2 Market Sizing and Forecast
3.3 PCR, Microarray, and Other Molecular Technologies
3.3.1 Overview
3.3.2 Market Sizing and Forecast
3.4 Spatial Biology Technologies
3.4.1 Overview
3.4.2 Market Sizing and Forecast
3.5 Others
3.5.1 Overview
3.5.2 Market Sizing and Forecast
4.1 Single-Cell Multiomics
4.1.1 Overview
4.1.2 Market Sizing and Forecast
4.2 Bulk Multiomics
4.2.1 Overview
4.2.2 Market Sizing and Forecast
5.1 Genomics
5.1.1 Overview
5.1.2 Market Sizing and Forecast
5.2 Proteomics
5.2.1 Overview
5.2.2 Market Sizing and Forecast
5.3 Transcriptomics
5.3.1 Overview
5.3.2 Market Sizing and Forecast
5.4 Metabolomics
5.4.1 Overview
5.4.2 Market Sizing and Forecast
5.5 Epigenomics
5.5.1 Overview
5.5.2 Market Sizing and Forecast
5.6 Others
5.6.1 Overview
5.6.2 Market Sizing and Forecast
6.1 Drug Discovery and Development
6.1.1 Overview
6.1.2 Market Sizing and Forecast
6.2 Biomarker Discovery and Validation
6.2.1 Overview
6.2.2 Market Sizing and Forecast
6.3 Molecular Profiling and Disease Characterization
6.3.1 Overview
6.3.2 Market Sizing and Forecast
6.4 Companion Diagnostics and Precision Medicine
6.4.1 Overview
6.4.2 Market Sizing and Forecast
6.5 Other Applications
6.5.1 Overview
6.5.2 Market Sizing and Forecast
7.1 Tissue
7.1.1 Overview
7.1.2 Market Sizing and Forecast
7.2 Blood
7.2.1 Overview
7.2.2 Market Sizing and Forecast
7.3 Plasma/Serum
7.3.1 Overview
7.3.2 Market Sizing and Forecast
7.4 Cell
7.4.1 Overview
7.4.2 Market Sizing and Forecast
7.5 Other Sample Types
7.5.1 Overview
7.5.2 Market Sizing and Forecast
8.1 Academic and Research Institutes
8.1.1 Overview
8.1.2 Market Sizing and Forecast
8.2 Pharmaceutical and Biotechnology Companies
8.2.1 Overview
8.2.2 Market Sizing and Forecast
8.3 Contract Research Organizations
8.3.1 Overview
8.3.2 Market Sizing and Forecast
8.4 Other End Users
8.4.1 Overview
8.4.2 Market Sizing and Forecast
9.1 Regional Summary
9.2 North America
9.2.1 Regional Overview
9.2.2 Driving Factors for Market Growth
9.2.3 Factors Challenging the Market
9.2.4 Analyst View
9.2.5 Market Sizing and Forecast
9.2.5.1 North America Multiomics Market, by Offering
9.2.5.2 North America Multiomics Market, by Technology
9.2.5.3 North America Multiomics Market, by Application
9.2.5.4 North America Multiomics Market, by End User
9.2.5.5 North America Multiomics Market, by Country
9.2.5.5.1 U.S.
9.2.5.5.2 Canada
9.3 Europe
9.3.1 Regional Overview
9.3.2 Driving Factors for Market Growth
9.3.3 Factors Challenging the Market
9.3.4 Analyst View
9.3.5 Market Sizing and Forecast
9.3.5.1 Europe Multiomics Market, by Offering
9.3.5.2 Europe Multiomics Market, by Technology
9.3.5.3 Europe Multiomics Market, by Application
9.3.5.4 Europe Multiomics Market, by End User
9.3.5.5 Europe Multiomics Market, by Country
9.3.5.5.1 U.K.
9.3.5.5.2 Germany
9.3.5.5.3 France
9.3.5.5.4 Italy
9.3.5.5.5 Spain
9.3.5.5.6 Rest-of-Europe
9.4 Asia-Pacific
9.4.1 Regional Overview
9.4.2 Driving Factors for Market Growth
9.4.3 Factors Challenging the Market
9.4.4 Analyst View
9.4.5 Market Sizing and Forecast
9.4.5.1 Asia-Pacific Multiomics Market, by Offering
9.4.5.2 Asia-Pacific Multiomics Market, by Technology
9.4.5.3 Asia-Pacific Multiomics Market, by Application
9.4.5.4 Asia-Pacific Multiomics Market, by End User
9.4.5.5 Asia-Pacific Multiomics Market, by Coun
9.4.5.5.1 China
9.4.5.5.2 Japan
9.4.5.5.3 India
9.4.5.5.4 Australia
9.4.5.5.5 South Korea
9.4.5.5.6 Rest-of-Asia-Pacific
9.5 Latin America
9.5.1 Regional Overview
9.5.2 Driving Factors for Market Growth
9.5.3 Factors Challenging the Market
9.5.4 Analyst View
9.5.5 Market Sizing and Forecast
9.5.5.1 Latin America Multiomics Market, by Offering
9.5.5.2 Latin America Multiomics Market, by Technology
9.5.5.3 Latin America Multiomics Market, by Application
9.5.5.4 Latin America Multiomics Market, by End User
9.5.5.5 Latin America Multiomics Market, by Country
9.5.5.5.1 Brazil
9.5.5.5.2 Mexico
9.5.5.5.3 Rest-of-Latin America
9.6 Middle East and Africa
9.6.1 Regional Overview
9.6.2 Driving Factors for Market Growth
9.6.3 Factors Challenging the Market
9.6.4 Analyst View
9.6.5 Market Sizing and Forecast
9.6.5.1 Middle East and Africa Multiomics Market, by Offering
9.6.5.2 Middle East and Africa Multiomics Market, by Technology
9.6.5.3 Middle East and Africa Multiomics Market, by Application
9.6.5.4 Middle East and Africa Multiomics Market, by End User
9.6.5.5 Middle East and Africa Multiomics Market, by Country
9.6.5.5.1 K.S.A.
9.6.5.5.2 South Africa
9.6.5.5.3 Rest-of-Middle East and Africa
10.1 Key Strategies and Developments, January 2023-June 2026
10.2 Key Developments Analysis (by Company)
10.3 Company Profiles
10.3.1 10x Genomics, Inc.
10.3.1.1 Overview
10.3.1.2 Top Products/Product Portfolio
10.3.1.3 Top Competitors
10.3.1.4 Key Personnel
10.3.1.5 Analyst View
10.3.2 Agilent Technologies, Inc.
10.3.2.1 Overview
10.3.2.2 Top Products/Product Portfolio
10.3.2.3 Top Competitors
10.3.2.4 Key Personnel
10.3.2.5 Analyst View
10.3.3 Bio-Rad Laboratories, Inc.
10.3.3.1 Overview
10.3.3.2 Top Products/Product Portfolio
10.3.3.3 Top Competitors
10.3.3.4 Key Personnel
10.3.3.5 Analyst View
10.3.4 Bio-Techne Corporation
10.3.4.1 Overview
10.3.4.2 Top Products/Product Portfolio
10.3.4.3 Top Competitors
10.3.4.4 Key Personnel
10.3.4.5 Analyst View
10.3.5 Bruker Corporation
10.3.5.1 Overview
10.3.5.2 Top Products/Product Portfolio
10.3.5.3 Top Competitors
10.3.5.4 Key Personnel
10.3.5.5 Analyst View
10.3.6 Danaher Corporation
10.3.6.1 Overview
10.3.6.2 Top Products/Product Portfolio
10.3.6.3 Top Competitors
10.3.6.4 Key Personnel
10.3.6.5 Analyst View
10.3.7 Illumina, Inc.
10.3.7.1 Overview
10.3.7.2 Top Products/Product Portfolio
10.3.7.3 Top Competitors
10.3.7.4 Key Personnel
10.3.7.5 Analyst View
10.3.8 Oxford Nanopore Technologies plc
10.3.8.1 Overview
10.3.8.2 Top Products/Product Portfolio
10.3.8.3 Top Competitors
10.3.8.4 Key Personnel
10.3.8.5 Analyst View
10.3.9 Pacific Biosciences of California, Inc.
10.3.9.1 Overview
10.3.9.2 Top Products/Product Portfolio
10.3.9.3 Top Competitors
10.3.9.4 Key Personnel
10.3.9.5 Analyst View
10.3.10 QIAGEN N.V.
10.3.10.1 Overview
10.3.10.2 Top Products/Product Portfolio
10.3.10.3 Top Competitors
10.3.10.4 Key Personnel
10.3.10.5 Analyst View
10.3.11 Quanterix Corporation
10.3.11.1 Overview
10.3.11.2 Top Products/Product Portfolio
10.3.11.3 Top Competitors
10.3.11.4 Key Personnel
10.3.11.5 Analyst View
10.3.12 Quantum-Si Incorporated
10.3.12.1 Overview
10.3.12.2 Top Products/Product Portfolio
10.3.12.3 Top Competitors
10.3.12.4 Key Personnel
10.3.12.5 Analyst View
10.3.13 Standard BioTools Inc.
10.3.13.1 Overview
10.3.13.2 Top Products/Product Portfolio
10.3.13.3 Top Competitors
10.3.13.4 Key Personnel
10.3.13.5 Analyst View
10.3.14 Thermo Fisher Scientific Inc.
10.3.14.1 Overview
10.3.14.2 Top Products/Product Portfolio
10.3.14.3 Top Competitors
10.3.14.4 Key Personnel
10.3.14.5 Analyst View
10.3.15 Waters Corporation
10.3.15.1 Overview
10.3.15.2 Top Products/Product Portfolio
10.3.15.3 Top Competitors
10.3.15.4 Key Personnel
10.3.15.5 Analyst View
11.1 Data Sources
11.1.1 Primary Data Sources
11.1.2 Secondary Data Sources
11.1.3 Data Triangulation
11.2 Market Estimation and Forecast
Table 1: Market Snapshot
Table 2: Ecosystem Structure
Table 3: Major Funding Activities, January 2023-June 2026
Table 4: Pricing Analysis
Table 5: Drivers, Challenges, and Opportunities: Current and Future Impact Assessment
Table 6: Global Multiomics Market (by Region), $Million, 2024-2036
Table 7: North America Multiomics Market (by Offering), $Million, 2024-2036
Table 8: North America Multiomics Market (by Technology), $Million, 2024-2036
Table 9: North America Multiomics Market (by Application), $Million, 2024-2036
Table 10: North America Multiomics Market (by End User), $Million, 2024-2036
Table 11: North America Multiomics Market (by Country), $Million, 2024-2036
Table 12: U.S. Multiomics Market (by Offering), $Million, 2024-2036
Table 13: U.S. Multiomics Market (by Technology), $Million, 2024-2036
Table 14: U.S. Multiomics Market (by Application), $Million, 2024-2036
Table 15: U.S. Multiomics Market (by End User), $Million, 2024-2036
Table 16: Canada Multiomics Market (by Offering), $Million, 2024-2036
Table 17: Canada Multiomics Market (by Technology), $Million, 2024-2036
Table 18: Canada Multiomics Market (by Application), $Million, 2024-2036
Table 19: Canada Multiomics Market (by End User), $Million, 2024-2036
Table 20: Europe Multiomics Market (by Offering), $Million, 2024-2036
Table 21: Europe Multiomics Market (by Technology), $Million, 2024-2036
Table 22: Europe Multiomics Market (by Application), $Million, 2024-2036
Table 23: Europe Multiomics Market (by End User), $Million, 2024-2036
Table 24: Europe Multiomics Market (by Country), $Million, 2024-2036
Table 25: U.K. Multiomics Market (by Offering), $Million, 2024-2036
Table 26: U.K. Multiomics Market (by Technology), $Million, 2024-2036
Table 27: U.K. Multiomics Market (by Application), $Million, 2024-2036
Table 28: U.K. Multiomics Market (by End User), $Million, 2024-2036
Table 29: Germany Multiomics Market (by Offering), $Million, 2024-2036
Table 30: Germany Multiomics Market (by Technology), $Million, 2024-2036
Table 31: Germany Multiomics Market (by Application), $Million, 2024-2036
Table 32: Germany Multiomics Market (by End User), $Million, 2024-2036
Table 33: France Multiomics Market (by Offering), $Million, 2024-2036
Table 34: France Multiomics Market (by Technology), $Million, 2024-2036
Table 35: France Multiomics Market (by Application), $Million, 2024-2036
Table 36: France Multiomics Market (by End User), $Million, 2024-2036
Table 37: Italy Multiomics Market (by Offering), $Million, 2024-2036
Table 38: Italy Multiomics Market (by Technology), $Million, 2024-2036
Table 39: Italy Multiomics Market (by Application), $Million, 2024-2036
Table 40: Italy Multiomics Market (by End User), $Million, 2024-2036
Table 41: Spain Multiomics Market (by Offering), $Million, 2024-2036
Table 42: Spain Multiomics Market (by Technology), $Million, 2024-2036
Table 43: Spain Multiomics Market (by Application), $Million, 2024-2036
Table 44: Spain Multiomics Market (by End User), $Million, 2024-2036
Table 45: Rest-of-Europe Multiomics Market (by Offering), $Million, 2024-2036
Table 46: Rest-of-Europe Multiomics Market (by Technology), $Million, 2024-2036
Table 47: Rest-of-Europe Multiomics Market (by Application), $Million, 2024-2036
Table 48: Rest-of-Europe Multiomics Market (by End User), $Million, 2024-2036
Table 49: Asia-Pacific Multiomics Market (by Offering), $Million, 2024-2036
Table 50: Asia-Pacific Multiomics Market (by Technology), $Million, 2024-2036
Table 51: Asia-Pacific Multiomics Market (by Application), $Million, 2024-2036
Table 52: Asia-Pacific Multiomics Market (by End User), $Million, 2024-2036
Table 53: Asia-Pacific Multiomics Market (by Country), $Million, 2024-2036
Table 54: China Multiomics Market (by Offering), $Million, 2024-2036
Table 55: China Multiomics Market (by Technology), $Million, 2024-2036
Table 56: China Multiomics Market (by Application), $Million, 2024-2036
Table 57: China Multiomics Market (by End User), $Million, 2024-2036
Table 58: Japan Multiomics Market (by Offering), $Million, 2024-2036
Table 59: Japan Multiomics Market (by Technology), $Million, 2024-2036
Table 60: Japan Multiomics Market (by Application), $Million, 2024-2036
Table 61: Japan Multiomics Market (by End User), $Million, 2024-2036
Table 62: India Multiomics Market (by Offering), $Million, 2024-2036
Table 63: India Multiomics Market (by Technology), $Million, 2024-2036
Table 64: India Multiomics Market (by Application), $Million, 2024-2036
Table 65: India Multiomics Market (by End User), $Million, 2024-2036
Table 66: Australia Multiomics Market (by Offering), $Million, 2024-2036
Table 67: Australia Multiomics Market (by Technology), $Million, 2024-2036
Table 68: Australia Multiomics Market (by Application), $Million, 2024-2036
Table 69: Australia Multiomics Market (by End User), $Million, 2024-2036
Table 70: South Korea Multiomics Market (by Offering), $Million, 2024-2036
Table 71: South Korea Multiomics Market (by Technology), $Million, 2024-2036
Table 72: South Korea Multiomics Market (by Application), $Million, 2024-2036
Table 73: South Korea Multiomics Market (by End User), $Million, 2024-2036
Table 74: Rest-of-Asia-Pacific Multiomics Market (by Offering), $Million, 2024-2036
Table 75: Rest-of-Asia-Pacific Multiomics Market (by Technology), $Million, 2024-2036
Table 76: Rest-of-Asia-Pacific Multiomics Market (by Application), $Million, 2024-2036
Table 77: Rest-of-Asia-Pacific Multiomics Market (by End User), $Million, 2024-2036
Table 78: Latin America Multiomics Market (by Offering), $Million, 2024-2036
Table 79: Latin America Multiomics Market (by Technology), $Million, 2024-2036
Table 80: Latin America Multiomics Market (by Application), $Million, 2024-2036
Table 81: Latin America Multiomics Market (by End User), $Million, 2024-2036
Table 82: Latin America Multiomics Market (by Country), $Million, 2024-2036
Table 83: Brazil Multiomics Market (by Offering), $Million, 2024-2036
Table 84: Brazil Multiomics Market (by Technology), $Million, 2024-2036
Table 85: Brazil Multiomics Market (by Application), $Million, 2024-2036
Table 86: Brazil Multiomics Market (by End User), $Million, 2024-2036
Table 87: Mexico Multiomics Market (by Offering), $Million, 2024-2036
Table 88: Mexico Multiomics Market (by Technology), $Million, 2024-2036
Table 89: Mexico Multiomics Market (by Application), $Million, 2024-2036
Table 90: Mexico Multiomics Market (by End User), $Million, 2024-2036
Table 91: Rest-of-Latin America Multiomics Market (by Offering), $Million, 2024-2036
Table 92: Rest-of-Latin America Multiomics Market (by Technology), $Million, 2024-2036
Table 93: Rest-of-Latin America Multiomics Market (by Application), $Million, 2024-2036
Table 94: Rest-of-Latin America Multiomics Market (by End User), $Million, 2024-2036
Table 95: Middle East and Africa Multiomics Market (by Offering), $Million, 2024-2036
Table 96: Middle East and Africa Multiomics Market (by Technology), $Million, 2024-2036
Table 97: Middle East and Africa Multiomics Market (by Application), $Million, 2024-2036
Table 98: Middle East and Africa Multiomics Market (by End User), $Million, 2024-2036
Table 99: Middle East and Africa Multiomics Market (by Country), $Million, 2024-2036
Table 100: K.S.A. Multiomics Market (by Offering), $Million, 2024-2036
Table 101: K.S.A. Multiomics Market (by Technology), $Million, 2024-2036
Table 102: K.S.A. Multiomics Market (by Application), $Million, 2024-2036
Table 103: K.S.A. Multiomics Market (by End User), $Million, 2024-2036
Table 104: South Africa Multiomics Market (by Offering), $Million, 2024-2036
Table 105: South Africa Multiomics Market (by Technology), $Million, 2024-2036
Table 106: South Africa Multiomics Market (by Application), $Million, 2024-2036
Table 107: South Africa Multiomics Market (by End User), $Million, 2024-2036
Table 108: Rest-of-Middle East and Africa Multiomics Market (by Offering), $Million, 2024-2036
Table 109: Rest-of-Middle East and Africa Multiomics Market (by Technology), $Million, 2024-2036
Table 110: Rest-of-Middle East and Africa Multiomics Market (by Application), $Million, 2024-2036
Table 111: Rest-of-Middle East and Africa Multiomics Market (by End User), $Million, 2024-2036
Table 112: Major Key Strategies, January 2023-June 2026
Figure 1: Global Multiomics Market (by Scenario), $Million, 2026, 2030, and 2036
Figure 2: Global Multiomics Market (by Region), $Million, 2024, 2030, 2036
Figure 3: Global Multiomics Market (by Offering), $Million, 2024, 2030, and 2036
Figure 4: Global Multiomics Market (by Technology), $Million, 2024, 2030, and 2036
Figure 5: Global Multiomics Market (by Approach Type), $Million, 2024, 2030, and 2036
Figure 6: Global Multiomics Market (by Omics), $Million, 2024, 2030, and 2036
Figure 7: Global Multiomics Market (by Application), $Million, 2024, 2030, and 2036
Figure 8: Global Multiomics Market (by Sample Type), $Million, 2024, 2030, and 2036
Figure 9: Global Multiomics Market (by End User), $Million, 2024, 2030, and 2036
Figure 10: Global Multiomics Market (by Offering), $Million, 2024, 2030, and 2036
Figure 11: Global Multiomics Market (Consumables and Reagents), $Million, 2024-2036
Figure 12: Global Multiomics Market (Sequencing Consumables and Reagents), $Million, 2024-2036
Figure 13: Global Multiomics Market (Mass Spectrometry Consumables and Reagents), $Million, 2024-2036
Figure 14: Global Multiomics Market (PCR, Microarray, and Other Molecular Consumables and Reagents), $Million, 2024-2036
Figure 15: Global Multiomics Market (Spatial Biology Consumables and Reagents), $Million, 2024-2036
Figure 16: Global Multiomics Market (Other Consumables and Reagents), $Million, 2024-2036
Figure 17: Global Multiomics Market (Instruments), $Million, 2024-2036
Figure 18: Global Multiomics Market (Sequencing Instruments), $Million, 2024-2036
Figure 19: Global Multiomics Market (Mass Spectrometers), $Million, 2024-2036
Figure 20: Global Multiomics Market (PCR, Microarray, and Other Molecular Instruments), $Million, 2024-2036
Figure 21: Global Multiomics Market (Spatial Biology Instruments), $Million, 2024-2036
Figure 22: Global Multiomics Market (Other Instruments), $Million, 2024-2036
Figure 23: Global Multiomics Market (Software), $Million, 2024-2036
Figure 24: Global Multiomics Market (by Technology), $Million, 2024, 2030, and 2036
Figure 25: Global Multiomics Market (Sequencing Technologies), $Million, 2024-2036
Figure 26: Global Multiomics Market (Mass Spectrometry Technologies), $Million, 2024-2036
Figure 27: Global Multiomics Market (PCR, Microarray, and Other Molecular Technologies), $Million, 2024-2036
Figure 28: Global Multiomics Market (Spatial Biology Technologies), $Million, 2024-2036
Figure 29: Global Multiomics Market (Others), $Million, 2024-2036
Figure 30: Global Multiomics Market (by Approach Type), $Million, 2024, 2030, and 2036
Figure 31: Global Multiomics Market (Single-Cell Multiomics), $Million, 2024-2036
Figure 32: Global Multiomics Market (Bulk Multiomics), $Million, 2024-2036
Figure 33: Global Multiomics Market (by Omics), $Million, 2024, 2030, and 2036
Figure 34: Global Multiomics Market (Genomics), $Million, 2024-2036
Figure 35: Global Multiomics Market (Proteomics), $Million, 2024-2036
Figure 36: Global Multiomics Market (Transcriptomics), $Million, 2024-2036
Figure 37: Global Multiomics Market (Metabolomics), $Million, 2024-2036
Figure 38: Global Multiomics Market (Epigenomics), $Million, 2024-2036
Figure 39: Global Multiomics Market (Others), $Million, 2024-2036
Figure 40: Global Multiomics Market (by Application), $Million, 2024, 2030, and 2036
Figure 41: Global Multiomics Market (Drug Discovery and Development), $Million, 2024-2036
Figure 42: Global Multiomics Market (Biomarker Discovery and Validation), $Million, 2024-2036
Figure 43: Global Multiomics Market (Molecular Profiling and Disease Characterization), $Million, 2024-2036
Figure 44: Global Multiomics Market (Companion Diagnostics and Precision Medicine), $Million, 2024-2036
Figure 45: Global Multiomics Market (Other Applications), $Million, 2024-2036
Figure 46: Global Multiomics Market (by Sample Type), $Million, 2024, 2030, and 2036
Figure 47: Global Multiomics Market (Tissue), $Million, 2024-2036
Figure 48: Global Multiomics Market (Blood), $Million, 2024-2036
Figure 49: Global Multiomics Market (Plasma/Serum), $Million, 2024-2036
Figure 50: Global Multiomics Market (Cell), $Million, 2024-2036
Figure 51: Global Multiomics Market (Other Sample Types), $Million, 2024-2036
Figure 52: Global Multiomics Market (by End User), $Million, 2024, 2030, and 2036
Figure 53: Global Multiomics Market (Academic and Research Institutes), $Million, 2024-2036
Figure 54: Global Multiomics Market (Pharmaceutical and Biotechnology Companies), $Million, 2024-2036
Figure 55: Global Multiomics Market (Contract Research Organizations), $Million, 2024-2036
Figure 56: Global Multiomics Market (Other End Users), $Million, 2024-2036
Figure 57: North America Multiomics Market, $Million, 2024-2036
Figure 58: U.S. Multiomics Market, $Million, 2024-2036
Figure 59: Canada Multiomics Market, $Million, 2024-2036
Figure 60: Europe Multiomics Market, $Million, 2024-2036
Figure 61: U.K. Multiomics Market, $Million, 2024-2036
Figure 62: Germany Multiomics Market, $Million, 2024-2036
Figure 63: France Multiomics Market, $Million, 2024-2036
Figure 64: Italy Multiomics Market, $Million, 2024-2036
Figure 65: Spain Multiomics Market, $Million, 2024-2036
Figure 66: Rest-of-Europe Multiomics Market, $Million, 2024-2036
Figure 67: Asia-Pacific Multiomics Market, $Million, 2024-2036
Figure 68: China Multiomics Market, $Million, 2024-2036
Figure 69: Japan Multiomics Market, $Million, 2024-2036
Figure 70: India Multiomics Market, $Million, 2024-2036
Figure 71: Australia Multiomics Market, $Million, 2024-2036
Figure 72: South Korea Multiomics Market, $Million, 2024-2036
Figure 73: Rest-of-Asia-Pacific Multiomics Market, $Million, 2024-2036
Figure 74: Latin America Multiomics Market, $Million, 2024-2036
Figure 75: Brazil Multiomics Market, $Million, 2024-2036
Figure 76: Mexico Multiomics Market, $Million, 2024-2036
Figure 77: Rest-of-Latin America Multiomics Market, $Million, 2024-2036
Figure 78: Middle East and Africa Multiomics Market, $Million, 2024-2036
Figure 79: K.S.A. Multiomics Market, $Million, 2024-2036
Figure 80: South Africa Multiomics Market, $Million, 2024-2036
Figure 81: Rest-of-Middle East and Africa Multiomics Market, $Million, 2024-2036
Figure 82: Key Strategies and Developments, January 2023-June 2026
Figure 83: Data Triangulation
Figure 84: Top-Down and Bottom-Up Approach
Figure 85: Assumptions and Limitations
Multiomics Market Reoprt Coverage
|
Multiomics Market |
|||
|
Base Year |
2025 |
Market Size in 2025 |
$3,412.8 Million |
|
Forecast Period |
2026-2036 |
Value Projection and Estimation by 2036 |
$12,827.0 Million |
|
CAGR During Forecast Period |
13.31% |
Number of Pages |
248 |
|
Number of Tables |
112 |
Number of Figures |
85 |
Key Market Players and Competition Synopsis
The companies profiled have been selected based on inputs gathered from an analysis of company coverage, product portfolio, and market penetration.
Some prominent names established in this market are:
• 10x Genomics, Inc.
• Agilent Technologies, Inc.
• Bio-Rad Laboratories, Inc.
• Bio-Techne Corporation
• Bruker Corporation
• Danaher Corporation
• Illumina, Inc.
• Oxford Nanopore Technologies plc
• Pacific Biosciences of California, Inc.
• QIAGEN N.V.
• Quanterix Corporation
• Quantum-Si Incorporated
• Standard BioTools Inc.
• Thermo Fisher Scientific Inc.
• Waters Corporation
How can this report add value to an organization?
Product/Innovation Strategy: The global multiomics market has been segmented across offering, technology, approach, omics type, sample type, application, end user, and region. This segmentation helps organizations understand demand across consumables and reagents, instruments, and software, along with adoption patterns across sequencing, mass spectrometry, spatial biology, PCR, microarray, and other molecular technologies.
Growth/Marketing Strategy: The global multiomics market is being driven by increasing use of integrated omics in drug discovery, biomarker validation, precision oncology, immuno-oncology, disease characterization, and translational research. This report helps organizations assess market entry opportunities, identify high-potential customer groups, and prioritize commercial strategies across academic and research institutes, pharmaceutical and biotechnology companies, contract research organizations, and other end users. It also supports regional opportunity assessment by highlighting differences in research funding, omics infrastructure, clinical adoption, and pharmaceutical R&D activity across major markets.
Competitive Strategy: The global multiomics market includes established life science technology companies, sequencing platform providers, mass spectrometry companies, spatial biology innovators, single-cell technology developers, reagent suppliers, and bioinformatics solution providers. The report helps organizations benchmark competitor presence, assess technology positioning, identify gaps across omics layers and application areas, and evaluate opportunities for partnerships, acquisitions, and portfolio expansion.
Methodology
Key Considerations and Assumptions in Market Engineering and Validation
• Years from 2024 to 2036 have been considered for the global market size estimation; 2025 has been considered as the base year, and 2026 to 2036 as the forecast period.
• The market revenue has been estimated to be the same as the companies’ net revenue distribution. All the numbers have been adjusted to one digit after the decimal for report presentation reasons. However, the real figures have been utilized for compound annual growth rate (CAGR) estimation. The CAGR has been calculated for the period from 2026 to 2036.
• In the study, the primary respondents' verification has been considered to finalize the estimated market for multiomics.
• The latest annual reports of each market player have been taken into consideration for market revenue calculation.
• Market strategies and developments of key players have been considered for the calculation of the sub-segment split.
• The base currency considered for the market analysis is US$. Currencies other than the US$ have been converted to the US$ for all statistical calculations, considering the average conversion rate for that particular year.
• The currency conversion rate has been taken from the historical exchange rate of the Oanda website or from the annual reports of the respective company, if stated.
Primary Research
The primary sources involve industry experts and key stakeholders across the life sciences, healthcare, and multiomics ecosystem, including multiomics platform providers, sequencing companies, mass spectrometry providers, spatial biology technology developers, bioinformatics software providers, pharmaceutical and biotechnology companies, academic research institutes, contract research organizations, and clinical research laboratories. Stakeholders have been consulted to validate adoption trends, workflow requirements, technology preferences, application areas, and end-user demand across genomics, transcriptomics, proteomics, metabolomics, epigenomics, single-cell, spatial, and integrated multiomics workflows. Respondents, including CEOs, vice presidents, product and marketing directors, research heads, laboratory directors, bioinformatics leaders, translational science leaders, and technology and innovation heads, have been interviewed to obtain and verify both qualitative and quantitative insights for this research study.
The key data points taken from the primary sources include:
• validation and triangulation of all the numbers and graphs
• validation of report segmentations and key qualitative findings
• understanding the competitive landscape and business model
• current and proposed production values of a product by market players
• validation of the numbers of different segments of the market in focus
• percentage split of individual markets for regional analysis
Secondary Research
Open Sources
• Certified publications, articles from recognized authors, white papers, directories, and major databases, among others
• Annual reports, SEC filings, and investors’ presentations of the leading market players
• Company websites and a detailed study of their product portfolio
• Gold standard magazines, journals, white papers, press releases, and news articles
• Paid databases
The key data points taken from the secondary sources include:
• segmentations and percentage shares
• data for market value
• key industry trends of the top players in the market
• qualitative insights into various aspects of the market, key trends, and emerging areas of innovation
• quantitative data for mathematical and statistical calculations
Global Multiomics Market Industry Overview

Introduction of the Global Multiomics Market
The global multiomics, initially valued at $3,412.8 million in 2025, is projected to grow substantially, reaching $12,827.0 million by 2036, with a remarkable compound annual growth rate (CAGR) of 13.31% from 2026 to 2036.
The global multiomics market has been experiencing strong growth, driven by the increasing need to understand complex biological systems through integrated molecular profiling. Multiomics enables the combined analysis of genomics, transcriptomics, proteomics, metabolomics, epigenomics, and other biological data layers to generate a more complete view of disease mechanisms, therapeutic response, biomarker behavior, and patient heterogeneity. The growing demand for precision medicine, biomarker discovery, drug discovery and development, disease characterization, and translational research is driving the adoption of multiomics workflows across pharmaceutical and biotechnology companies, academic research institutes, contract research organizations, and clinical research settings. This expanding use of integrated biological analysis is encouraging investment in advanced instruments, consumables and reagents, and bioinformatics software that can support high-throughput, reproducible, and scalable multiomics studies.
Advances in multiomics remain increasingly focused on improving data depth, workflow integration, analytical accuracy, and biological interpretation. Key advancements include single-cell multiomics, spatial biology platforms, next-generation sequencing, high-resolution mass spectrometry, multiplexed assays, automated sample preparation, and AI-enabled bioinformatics tools for multi-layer data integration. These innovations are helping address challenges related to biological complexity, sample heterogeneity, data standardization, and interpretation of large-scale omics datasets. The growing adoption of cloud-based analytics, interoperable data platforms, and integrated software pipelines is further driving market expansion, positioning multiomics as a critical enabler of precision medicine, translational discovery, and next-generation life sciences research.
Industrial Impact
The global multiomics market is becoming increasingly competitive as life science tools, sequencing, proteomics, spatial biology, and bioinformatics companies expand across integrated research workflows. Market participants are moving beyond standalone instruments and assays toward connected sample-to-insight ecosystems that combine high-performance platforms, reliable consumables, automation, and scalable analytics. Product innovation remains a key differentiator, with companies focusing on sequencing accuracy, proteomic depth, spatial resolution, multiplexing, throughput, and data interpretation. Established and specialized players such as 10x Genomics, Illumina, Oxford Nanopore Technologies, QIAGEN, and Thermo Fisher Scientific are strengthening their positions across different layers of the multiomics value chain. Competition is also intensifying around software integration and workflow usability as researchers require tools that can manage complex multi-layer datasets with minimal operational friction. Overall, industry impact is shifting toward platform consolidation, workflow standardization, and application-specific solutions that support precision medicine, biomarker discovery, drug development, and translational research.
Market Segmentation:
Segmentation 1: By Offering
• Consumables and Reagents
• Instruments
• Software
Consumables and Reagents Segment to Dominate the Global Multiomics Market (by Offering)
In 2025, based on offering, consumables and reagents accounted for the largest share of the global multiomics market. This leadership has been primarily driven by their recurring use across multiomics workflows, including sample preparation, library preparation, sequencing, protein analysis, metabolite profiling, spatial assays, polymerase chain reaction (PCR), microarray workflows, and other molecular analysis processes. As multiomics studies require repeated experimental runs, assay validation, quality control, and sample-specific processing, demand for reagents, kits, probes, antibodies, buffers, cartridges, and other consumables remains consistent across academic, biopharmaceutical, and contract research settings.
Segmentation 2: By Technology
• Sequencing Technologies
• Mass Spectrometry Technologies
• PCR, Microarray, and Other Molecular Technologies
• Spatial Biology Technologies
• Others
Sequencing Technologies Segment to Dominate the Global Multiomics Market (by Technology)
In 2025, on the basis of technology, the sequencing technologies segment accounted for the largest share of the global multiomics market. Their leadership has been supported by their central role in generating high-resolution genomic, transcriptomic, epigenomic, and single-cell data, which form the foundation of many multiomics workflows. Sequencing is widely used across disease profiling, biomarker discovery, drug target identification, patient stratification, companion diagnostics research, and precision medicine studies. Its ability to generate large-scale molecular information from diverse sample types makes it a core technology for integrating multiple omics layers and understanding disease biology at both population and cellular levels. The continued adoption of sequencing technologies is also driven by improvements in throughput, accuracy, scalability, sample compatibility, and bioinformatics integration.
Segmentation 3: By Application
• Drug Discovery and Development
• Biomarker Discovery and Validation
• Molecular Profiling and Disease Characterization
• Companion Diagnostics and Precision Medicine
• Other Applications
Drug Discovery and Development Segment to Dominate the Global Multiomics Market (by Application)
In 2025, on the basis of application, drug discovery and development accounted for the largest share of the global multiomics market. This leadership has been supported by the increasing use of multiomics to improve target identification, disease pathway analysis, mechanism-of-action studies, drug-response evaluation, and translational research. By integrating genomic, transcriptomic, proteomic, metabolomic, and epigenomic data, researchers can gain a more complete understanding of disease biology and identify molecular drivers that may not be evident through single-omics analysis. This makes multiomics highly relevant across early discovery, preclinical development, clinical trial design, and therapeutic optimization.
Segmentation 4: By Approach Type
• Bulk Multiomics
• Single-Cell Multiomics
Bulk Multiomics Segment to Dominate the Global Multiomics Market (by Approach Type)
In 2025, on the basis of approach type, bulk multiomics accounted for the largest share of the global multiomics market as it remains the more established and widely adopted approach across drug discovery, biomarker validation, disease profiling, and population-scale research. Its broader use has been supported by lower workflow complexity, relatively better protocol standardization, higher sample throughput, and stronger compatibility with existing sequencing, mass spectrometry, and bioinformatics infrastructure. Pharmaceutical companies, academic institutes, and clinical research groups continue to rely on bulk multiomics for cost-efficient, large-cohort analysis, while single-cell multiomics is expanding rapidly from a smaller base due to its higher cost, technical complexity, and specialized data interpretation requirements.
Segmentation 5: By Omics
• Genomics
• Proteomics
• Transcriptomics
• Metabolomics
• Epigenomics
• Others
Genomics Segment to Dominate the Multiomics Market (by Omics)
In 2025, on the basis of omics, genomics accounts for the largest share of the global multiomics market as it represents the most mature, scalable, and widely adopted omics layer across research, clinical, and pharmaceutical workflows. Segment growth has been supported by a strong sequencing infrastructure, declining sequencing costs, and broad use in oncology, rare disease, population genomics, biomarker discovery, and companion diagnostics. Genomic data also serves as the foundational layer for integrating transcriptomic, proteomic, epigenomic, and metabolomic insights, making it the primary entry point for most multiomics studies.
Segmentation 6: By Sample Type
• Tissue
• Blood
• Plasma/Serum
• Cell
• Other Sample Types
Tissue Segment to Dominate the Multiomics Market (by Sample Type)
In 2025, on the basis of sample type, tissue accounts for the largest share of the global multiomics market. Its leadership has been supported by the critical role of tissue-based analysis in understanding disease architecture, cellular composition, molecular heterogeneity, and microenvironment-level interactions. Tissue samples are widely used in oncology, immunology, neuroscience, infectious disease research, inflammatory diseases, and rare disease studies, where spatial context and cell-to-cell interactions are important for interpreting disease biology. Multiomics analysis of tissue enables researchers to integrate genomic, transcriptomic, proteomic, epigenomic, and spatial data to better understand disease progression, therapeutic response, and mechanisms of resistance.
Segmentation 7: By End User
• Academic and Research Institutes
• Pharmaceutical and Biotechnology Companies
• Contract Research Organizations
• Other End Users
Academic and Research Institutes Segment to Dominate the Multiomics Market (by End User)
In 2025, on the basis of end user, academic and research institutes account for the largest share of the global multiomics market. This has been supported by their strong involvement in basic research, disease biology, cell atlas initiatives, biomarker discovery, single-cell studies, spatial biology, and translational research. Universities, government-funded laboratories, medical research centers, and nonprofit research organizations continue to be early adopters of multiomics technologies, as they often focus on understanding complex biological mechanisms across genomics, transcriptomics, proteomics, metabolomics, epigenomics, and other molecular layers. Their role is particularly important in oncology, immunology, neuroscience, infectious diseases, rare diseases, and developmental biology, where multiomics enables deeper investigation of disease pathways and cellular heterogeneity.
Segmentation 8: By Region
• North America
o U.S.
o Canada
• Europe
o U.K.
o Germany
o France
o Italy
o Spain
o Rest-of-Europe
• Asia-Pacific
o China
o Japan
o India
o South Korea
o Australia
o Rest-of-Asia-Pacific
• Latin America
o Brazil
o Mexico
o Rest-of-Latin America
• Middle East and Africa
o K.S.A.
o South Africa
o Rest-of-Middle East and Africa
North America to Dominate the Multiomics Market (by Region)
In 2025, North America accounted for the largest share of the global multiomics market. This dominance has been established by strong adoption of sequencing, mass spectrometry, single-cell analysis, spatial biology, and advanced bioinformatics platforms across academic research institutes, pharmaceutical and biotechnology companies, and clinical research settings. The U.S. continues to anchor regional demand due to its mature life sciences ecosystem, high concentration of genomics and proteomics research centers, extensive biopharmaceutical R&D activity, and increasing use of multiomics in translational medicine, biomarker discovery, drug development, and precision oncology.
Recent Developments in the Multiomics Market
• In June 2026, 10x Genomics, Inc. acquired Proteintech Genomics to expand its proteomics capabilities and strengthen integrated single-cell and spatial multiomics workflows.
• In January 2026, Illumina, Inc. announced the launch of Illumina Connected Multiomics, a cloud-based research software platform designed to analyze and visualize multiomic and multimodal biological data at scale. The platform integrates data across transcriptomics, genomics, proteomics, epigenetics, single-cell, and spatial biology workflows, helping researchers reduce bioinformatics complexity and accelerate biological discovery.
Demand – Drivers, Challenges, and Opportunities
Market Drivers
• Rising Application of Multiomics in Drug Discovery, Drug Repurposing, and Therapeutic Target Identification: The growing application of multiomics in drug discovery is driving the market toward integrated, decision-support-driven discovery platforms, away from standalone omics data generation. By combining multiple molecular layers with AI-enabled analytics, multiomics enables drug developers to improve target confidence, identify resistance mechanisms, support drug repurposing, and strengthen biomarker-led clinical development strategies. This creates a strong commercial opportunity for vendors that can provide connected workflows across sample preparation, sequencing, mass spectrometry, spatial biology, single-cell analysis, and bioinformatics. In the near term, adoption is expected to remain strongest among pharma and biotech companies with advanced R&D infrastructure; however, the long-term market opportunity will depend on reproducible workflows, interoperable data systems, and interpretable outputs that can be embedded into routine decision-making in discovery and translational research.
• Increasing Demand for Precision Oncology and Immuno-Oncology Research: The rising demand for precision oncology and immuno-oncology research is positioning multiomics as a structural growth driver rather than a niche research capability. Oncology remains one of the most commercially attractive application areas because it requires high-resolution biological understanding across tumor cells, immune cells, stromal components, molecular pathways, and spatial tissue architecture. Vendors offering integrated workflows across sequencing, spatial biology, proteomics, single-cell analysis, consumables, reagents, and AI-enabled analytics are likely to benefit as cancer researchers move from single-biomarker testing toward multi-layer molecular profiling. However, differentiation will increasingly depend on the ability to deliver reproducible workflows, clinically relevant biomarker insights, scalable software, and interpretable outputs that can support translational research and future clinical decision-making.
Market Challenges
• Reproducibility and Batch-Effect Concerns Limiting Translational Adoption of Multiomics: Reproducibility and batch-effect concerns represent a practical restraint because they directly affect the credibility and scalability of multiomics workflows. As multiomics moves closer to clinical research and biomarker-driven decision-making, end users will increasingly require evidence that results are consistent across platforms, sites, reagent lots, sample types, and analytical pipelines. This creates pressure on vendors to move beyond data-generation capability and offer standardized workflows, built-in quality control, reference-material compatibility, robust batch-correction tools, and transparent data-processing pipelines. In the near term, these issues may slow adoption among clinical laboratories and smaller research centers with limited bioinformatics resources. However, vendors that can demonstrate reproducible, validated, and interoperable workflows are likely to gain a competitive advantage as the market shifts from exploratory multiomics toward translational and clinically relevant applications.
Market Opportunities
• Blockchain-Enabled Secure Data Management: Blockchain-enabled secure data management is best positioned as a future-facing niche opportunity. Its commercial value will not come from replacing sequencing, mass spectrometry, spatial biology, or analytics platforms, but from adding a trusted governance layer around sensitive multiomics data exchange. As multiomics workflows become more collaborative and AI-driven, stakeholders will need stronger mechanisms for consent tracking, data provenance, controlled access, and auditability. Vendors that can integrate blockchain-enabled consent and access management into cloud-based multiomics platforms may gain a differentiated position. However, near-term adoption will remain limited unless blockchain solutions demonstrate scalability, interoperability, regulatory alignment, and clear usability for researchers, clinicians, and data-governance teams.
Analyst’s Thoughts
According to Swati Sood, Principal Analyst - BIS Research, “The global multiomics market is moving from exploratory research adoption toward more structured use across drug discovery, biomarker validation, precision oncology, and translational research. The market opportunity is being shaped by the convergence of sequencing, proteomics, spatial biology, single-cell analysis, and advanced bioinformatics into integrated workflows. While academic and research institutes continue to anchor adoption, pharmaceutical and biotechnology companies are expected to drive higher-value use cases as multiomics becomes more embedded in target discovery, patient stratification, and therapy-response assessment. Companies that can deliver reproducible workflows, scalable software, high-quality consumables, and interpretable multi-layer data outputs are likely to gain a stronger competitive position over the forecast period.”
Multiomics Market - A Global and Regional Analysis
Focus on Offering, Technology, Approach Type, Omics, Application, Sample Type, End User, and Regional Analysis - Analysis and Forecast Year, 2026-2036
Frequently Asked Questions
Ans: Multiomics refers to the integrated analysis of multiple omics layers, such as genomics, transcriptomics, proteomics, metabolomics, and epigenomics, to generate a more complete understanding of biological systems. It enables researchers to study how genes, RNA, proteins, metabolites, and regulatory mechanisms interact across disease pathways, drug response, biomarker discovery, and precision medicine applications.
Ans: Market players in the global multiomics market are focusing on product launches, workflow integration, partnerships, acquisitions, and platform expansion to strengthen their competitive position. Companies are introducing cloud-based multiomics analytics platforms, advanced sequencing-compatible workflows, high-throughput mass spectrometry systems, and integrated single-cell and spatial multiomics solutions. Strategic acquisitions are also being used to expand technology capabilities, while partnerships with sequencing, automation, molecular biology, and spatial biology companies are helping vendors build more connected sample-to-insight ecosystems.
Ans: The following are the USPs of this report:
• Market regulations and key trends in the global multiomics market
• Market dynamic analysis of the opportunities, trends, and challenges in the market
• Detailed segmentation across offering, technology, approach, omics type, sample type, application, end user, and region
Ans: This report is valuable for life science technology companies, sequencing platform providers, mass spectrometry companies, single-cell and spatial biology solution providers, reagent and consumable manufacturers, bioinformatics and cloud analytics vendors, pharmaceutical and biotechnology companies, contract research organizations, academic and research institutes, investors, and strategic decision-makers. It can help these stakeholders assess market opportunities, benchmark competitors, identify high-growth applications, evaluate regional demand, and plan product, innovation, growth, and partnership strategies in the global multiomics market.