Published Year: 2026
Digital Breast Tomosynthesis Market - A Global and Regional Analysis: Focus on End User, Regional, a
The global digital breast tomosynthesis (DBT) market is projected to reach $2,894.6 million by...
Focus on Technology, Cancer Sub-Type, Biomarker, Offering, End User, and Country Analysis - Analysis and Forecast, 2023-2032
Delivery Time: 1 Working Day
Get ISO Certified Research, Customization, Data Extraction, and Value-Added Services with All BIS Research Reports
BIS Research provides a comprehensive report library with unlimited access to data, insights, and market intelligence through Subscription.
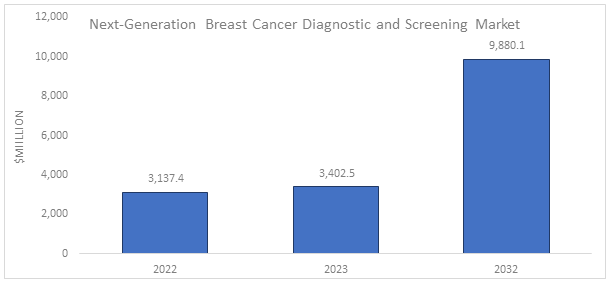
Get Subscription Know MoreThe global next-generation breast cancer diagnostic and screening market was valued at $3,137.4 million in 2022 and is anticipated to reach $9,880.1 million by 2032, witnessing a CAGR of 12.57% during the forecast period 2023-2032. The growth in the global next-generation breast cancer diagnostic and screening market is expected to be driven by the increase in the prevalence of breast cancer cases globally, rising awareness regarding early diagnosis of breast cancer, growing focus on breast cancer biomarkers for effective screening, prognosis, and personalized treatment, and increasing partnerships and collaborations amongst market players.
Market Lifecycle Stage
The next-generation breast cancer diagnostic and screening market is in the developing phase. Technological advancements in the development of next-generation breast cancer diagnostics and the growing scope for molecular breast cancer diagnosis techniques in emerging countries can be some of the major opportunities in the global next-generation breast cancer diagnostic and screening market. Furthermore, some of the key trends going on in the market are the implementation of liquid biopsy for breast cancer diagnosis and the complete automation of next-generation techniques.
Impact of COVID-19
COVID-19 had a significant impact on the global next-generation breast cancer diagnostic and screening market. There was a significant shift observed toward research activities for treating and diagnosing COVID-19, which resulted in a halt in research activities for next-generation breast cancer diagnostic and screening. Moreover, the market players witnessed a loss in 2020 due to COVID-19 restrictions and prevention actions such as a reduction in supply chain and sales.
However, since the situations are now almost back to normal, the next-generation breast cancer diagnostic and screening market is expected to overcome all the impact of COVID-19 during the forecast period 2023-2032.
Market Segmentation:
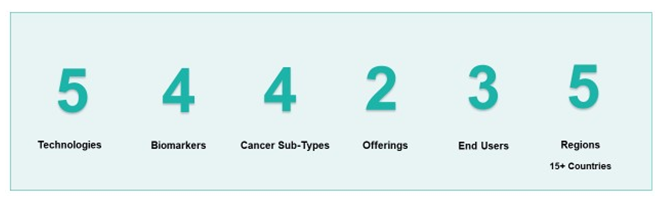
Segmentation 1: by Technology
• Real-Time PCR
• Immunohistochemistry (IHC)
• Next-Generation Sequencing (NGS)
• Fluorescence In-Situ Hybridization (FISH)
• Others
Based on technology, the global next-generation breast cancer diagnostic and screening market is expected to be dominated by the immunohistochemistry (IHC) segment.
Segmentation 2: by Biomarker
• BRCA1/2
• ER/PR Receptors
• HER-2
• Others
Based on biomarker, the global next-generation breast cancer diagnostic and screening market is dominated by the BRCA1/2 segment.
Segmentation 3: by Cancer Sub-Type
• Luminal A
• Luminal B
• Triple Negative/Basal Like
• Human Epidermal Growth Factor Receptor 2 (HER-2) Enriched
Based on cancer sub-type, the global next-generation breast cancer diagnostic and screening market is dominated by the luminal A segment.
Segmentation 4: by Offering
• Products
• Services
Based on offering, the global next-generation breast cancer diagnostic and screening market is dominated by the services segment.
Segmentation 5: by End User
• Hospitals and Clinics
• Diagnostic Centers and Reference Labs
• Academic and Research Institutes
Based on end user, the global next-generation breast cancer diagnostic and screening market is dominated by the hospitals and clinics segment.
Segmentation 6: by Region
• North America - U.S., Canada
• Europe - Germany, France, U.K., Italy, Spain, and Rest-of-Europe
• Asia-Pacific - Japan, China, India, Australia, South Korea, Singapore, and Rest-of-Asia-Pacific
• Latin America - Brazil, Mexico, and Rest-of-Latin America
• Rest-of-the-World
Based on region, the global next-generation breast cancer diagnostic and screening market is dominated by North America.
Recent Developments in the Global Next-Generation Breast Cancer Diagnostic and Screening Market
• In April 2023, Syantra Inc., a Canada-based company, received CE mark approval for its Syantra DX breast cancer test.
• In March 2023, NeoGenomics, Inc. launched its RaDaR assay, which is a liquid biopsy test for minimal residual disease (MRD).
• In February 2023, HALO Diagnostics launched its new HALO pathway for early breast cancer detection.
• In January 2023, Agilent Technologies, Inc. acquired Avida Biomed, a company that develops high-performance NGS target enrichment workflows for cancer research.
• In October 2022, Lucence Diagnostics Pte Ltd entered into a distribution partnership with Omnigen, under which Omnigen would distribute Lucence Diagnostics Pte Ltd’s LiquidHALLMARK assay in Turkey.
• In March 2022, Myriad Genetics, Inc. received the U.S. FDA approval for its BRACanalysis CDx for being used as a companion diagnostic test and for the identification of breast cancer patients who may benefit from Lynparza in early breast cancer stages.
• In February 2022, Laboratory Corporation of America Holdings acquired Personal Genome Diagnostics Inc., a company that deals in cancer genomics and provides an assortment of comprehensive liquid biopsy and tissue-based products.
• In January 2022, Agendia Inc. entered into a partnership with Illumina Inc. to expand genomic testing for breast cancer care.
• In December 2021, Exai Bio, Inc. raised funding of $67.5 million as a part of its Series A funding round. The funding was in order to bring advancement in the next-generation RNA-based liquid biopsy platform of the company, which is indicated for early detection of cancer.
• In June 2021, Veracyte, Inc. acquired HalioDx for an amount of $318 million to expand its portfolio in cancer in-vitro diagnostics.
• In May 2021, Hologic, Inc. acquired Biotheranostics, Inc., a company that provides molecular diagnostic tests for breast and metastatic cancers.
• In November 2020, Agilent Technologies, Inc. received U.S. FDA approval for its PD-L1 IHC 22C3 pharmDx for triple-negative breast cancer.
Demand - Drivers and Limitations
Following are the drivers for the global next-generation breast cancer diagnostic and screening market:
• Increasing Prevalence of Breast Cancer Globally
• Increased Awareness Regarding Early Diagnosis of Breast Cancer
• Growing Focus on Breast Cancer Biomarkers for Effective Screening, Prognosis, and Personalized Treatment
• Increasing Partnerships and Collaborations amongst Market Players
The market is expected to face some limitations as well due to the following restraints:
• High Cost of Tests and Requirement of High Capital Investment for Testing Set-Up
• Occurrence of False Positive and False Negative Results
Analyst Thoughts
According to Satyendrsingh Rajput, Lead Research Analyst, BIS Research, "The increasing burden of breast cancer is leading to a rise in demand for early and effective diagnosis and screening of the disease, which is leading to the adoption of genomic and molecular-based tests that can provide information to healthcare professionals regarding genetic mutations, tumor grade, and presence of hormone receptors, among others. With the development of these diagnostic techniques, the clinical practice for the treatment of cancer is moving toward a more holistic approach of providing prognostic value and personalized therapeutics for the treatment. This inclination toward a personalized approach is paving the way for the growth of the next-generation breast cancer diagnostic and screening market.”
Focus on Technology, Cancer Sub-Type, Biomarker, Offering, End User, and Country Analysis - Analysis and Forecast, 2023-2032
The next-generation breast cancer diagnosis and screening includes several genomic and molecular-based assays developed using different technologies, including immunohistochemistry (IHC), fluorescence in-situ hybridization (FISH), next-generation sequencing (NGS), and real-time polymerase chain reaction (RT-PCR), among others. The diagnostics assay uses the potential breast-tumor markers and facilitates the yielding of exceptionally fast results for early clinical decision-making.
The key trends going on in the market are the adoption of liquid biopsy for breast cancer diagnosis and the complete automation of next-generation techniques.
The global next-generation breast cancer diagnostic and screening market has seen major development by key players operating in the market, such as business expansions, partnerships, alliances, product launches, regulatory and legal activities, funds, grants, and mergers and acquisitions. According to BIS Research analysis, partnerships, alliances, and business expansions accounted for the maximum number of key developments, followed by regulatory and legal activities and mergers and acquisitions.
A new entrant can focus on multiple biomarker assessment tests, liquid biopsy tests, and incorporation of artificial intelligence (AI) at molecular levels.
The following can be considered as some of the USPs of this report:
· Overview of the overall oncology molecular diagnostics market
· Key trends and opportunities of the market
· Regulatory framework and list of regulatory-approved products
· Breast cancer clinical trials
· Advantages and limitations of different techniques
· Product pricing
· Impact of COVID-19 on the market
· Market dynamics, including drivers and restraints
· Opportunity mapping by each segment and by companies
· Region and country-level analysis, including market dynamics and market size and forecast
· Market share analysis of key players in the market
The companies developing next-generation genomic and molecular-based assays for breast cancer diagnosis and screening or looking to leverage such assays in the field of oncology (breast cancer) should buy this report. Academic and research institutes working on the development of such assays/techniques for breast cancer can also buy this report.
The global digital breast tomosynthesis (DBT) market is projected to reach $2,894.6 million by...
The Middle East molecular diagnostics market is projected to reach $1,017.7 million by 2031...
The global molecular diagnostics market is projected to reach $24,228.0 million by 2031 from...
The global rare disease diagnostics market has been currently witnessing a rapid growth and is...