A quick peek into the report
Table of Contents
1.1 Inclusion and Exclusion
2.1 Research Scope
3.1 Primary Data Sources
3.2 Secondary Data Sources
3.3 Market Estimation Model
3.4 Selection Criteria for Company Profiles
4.1 Introduction
4.2 Enabling Technologies of Precision Medicine Emphasizing Focus on Prevention
4.3 Promising Potential and Role of Precision Medicine
5.1 Unprecedented Demand for Non-Oncology Precision Medicine Due to COVID-19
5.2 COVID-19 Affecting Supply Chain of Non-Oncology Precision Medicine-Based Therapies
5.3 Measures Taken to Address Current Problem
6.1 Legal and Regulatory Framework and Requirements
6.1.1 North America
6.1.1.1 Regulatory Requirements in U.S.
6.1.2 Europe
6.1.3 Asia-Pacific
6.2 Patent Landscape
7.1 Overview
7.2 Market Driving Factors
7.2.1 Improved Availability of Targeted Therapies and Decreasing Trial and Error-Based Prescription
7.2.2 Reduced Chances of Adverse Drug Reactions
7.2.3 Decreasing Overall Cost of Genome Sequencing
7.2.4 Rising Prevalence of Chronic Diseases
7.3 Market Restraining Factors
7.3.1 Unclear Regulatory Framework and Reimbursement Scenario for Personalized Medicine
7.3.2 Limited Knowledge About Molecular Mechanism/Interaction
7.3.3 Integrating and Securing Electronic Health Records
7.4 Market Opportunities
7.4.1 Research Alliance Across Industry and Academia Accelerating Market Entry
7.4.2 Strong Pipeline and Increasing FDA Approvals
8.1 Key Strategies and Developments
8.1.1 Product Offerings
8.1.2 Partnerships and Alliances
8.1.3 Regulatory and Legal
8.1.4 Mergers and Acquisitions
8.1.5 Funding and Investments
8.2 Market Share Analysis
8.3 Growth-Share Analysis (by Company), 2019
9.1 Overview
9.2 Infectious Diseases
9.2.1 Respiratory Infections
9.2.2 Gastrointestinal Infections
9.2.3 Sexually Transmitted Infections
9.2.4 Others
9.3 Neurology/Physiatry
9.3.1 Neurodegenerative Disorders
9.3.2 Neuropsychiatric Disorders
9.3.3 Others
9.4 Lifestyle and Endocrinology
9.5 Cardiovascular
9.5.1 Cardiac Myopathies and Arrhythmia
9.5.2 Others
9.6 Gastroenterology
9.7 Other Applications
10.1 Overview
10.2 Applied Sciences
10.2.1 Genomics
10.2.2 Global Non-Oncology Precision Medicine Genomics Market (by Technology)
10.2.2.1 Polymerase Chain Reaction (PCR)
10.2.2.2 Precision Medicine Next-Generation Sequencing (PM NGS)
10.2.2.3 Genome Editing
10.2.2.4 Other Technologies
10.2.3 Pharmacogenomics
10.2.4 Other Applied Sciences
10.3 Precision Diagnostics
10.3.1 Molecular Diagnostics (MDx)
10.3.2 Medical Imaging
10.4 Digital Health and Information Technology
10.4.1 Clinical Decision Support Systems (CDSS)
10.4.2 Big Data Analytics
10.4.3 IT Infrastructure
10.4.4 Genomics Informatics
10.4.5 In-Silico Informatics
10.4.6 Mobile Health
10.5 Precision Therapeutics
10.5.1 Clinical Trials
10.5.2 Cell Therapy
10.5.3 Drug Discovery and Research
10.5.4 Gene Therapy
11.1 Overview
11.2 North America
11.2.1 U.S.
11.2.2 Canada
11.3 Europe
11.3.1 Germany
11.3.2 France
11.3.3 Italy
11.3.4 U.K.
11.3.5 Spain
11.3.6 Rest-of-Europe
11.4 Asia-Pacific (APAC)
11.4.1 China
11.4.2 Japan
11.4.3 Australia
11.4.4 India
11.4.5 Rest-of-Asia-Pacific
11.5 Latin America
11.5.1 Brazil
11.5.2 Mexico
11.5.3 Rest-of-LATAM
11.6 Rest-of-the-World
11.6.1 Rest-of-the-World Non-Oncology Precision Medicine Market Dynamics
12.1 Abbott Laboratories
12.1.1 Company Overview
12.1.2 Role of Abbott Laboratories in Global Non-Oncology Precision Medicine Market
12.1.3 Financials
12.1.4 SWOT Analysis
12.2 Agilent Technologies, Inc.
12.2.1 Company Overview
12.2.2 Role of Agilent Technologies, Inc. in Global Non-Oncology Precision Medicine Market
12.2.3 Financials
12.2.4 SWOT Analysis
12.3 Almac Group Ltd.
12.3.1 Company Overview
12.3.2 Role of Almac Group Ltd. in Global Non-Oncology Precision Medicine Market
12.3.3 SWOT Analysis
12.4 Astra Zeneca
12.4.1 Company Overview
12.4.2 Role of Astra Zeneca in Global Non-Oncology Precision Medicine Market
12.4.3 Financials
12.4.4 SWOT Analysis
12.5 ASURAGEN INC.
12.5.1 Company Overview
12.5.2 Role of ASURAGEN Inc. in Global Non-Oncology Precision Medicine Market
12.5.3 SWOT Analysis
12.6 BGI Group
12.6.1 Company Overview
12.6.2 Role of BGI Group in Global Non-Oncology Precision Medicine Market
12.6.3 SWOT Analysis
12.7 Bio-Rad Laboratories, Inc.
12.7.1 Company Overview
12.7.2 Role of Bio-Rad Laboratories, Inc.in Global Non-Oncology Precision Medicine Market
12.7.3 Financials
12.7.4 SWOT Analysis
12.8 bioMérieux S.A.
12.8.1 Company Overview
12.8.2 Role of bioMérieux SA. in Global Non-Oncology Precision Medicine Market
12.8.3 Financials
12.8.4 SWOT Analysis
12.9 Bristol-Myers Squibb Company
12.9.1 Company Overview
12.9.2 Role of Bristol-Myers Squibb Company in Global Non-Oncology Precision Medicine Market
12.9.3 Financials
12.9.4 SWOT Analysis
12.10 Danaher Corporation
12.10.1 Company Overview
12.10.2 Role of Danaher Corporation in Global Non-Oncology Precision Medicine Market
12.10.3 Financials
12.10.4 SWOT Analysis
12.11 F. Hoffmann-La Roche Ltd
12.11.1 Company Overview
12.11.2 Role of F. Hoffman-LA Roche Ltd in Global Non-Oncology Precision Medicine Market
12.11.3 Financials
12.11.4 SWOT Analysis
12.12 Gilead Sciences, Inc.
12.12.1 Company Overview
12.12.2 Role of Gilead Sciences, Inc. in Global Non-Oncology Precision Medicine Market
12.12.3 Financials
12.12.4 SWOT Analysis
12.13 GlaxoSmithKline plc
12.13.1 Company Overview
12.13.2 Role of GlaxoSmithKline Plc in Global Non-Oncology Precision Medicine Market
12.13.3 Financials
12.13.4 SWOT Analysis
12.14 Invitae Corporation
12.14.1 Company Overview
12.14.2 Role of Invitae Corporation in Global Non-Oncology Precision Medicine Market
12.14.3 Financials
12.14.4 SWOT Analysis
12.15 Illumina, Inc.
12.15.1 Company Overview
12.15.2 Role of Illumina, Inc. in Global Non-Oncology Precision Medicine Market
12.15.3 Financials
12.15.4 SWOT Analysis
12.16 Konica Minolta, Inc.
12.16.1 Company Overview
12.16.2 Role of Konica Minolta, Inc. in Global Non-Oncology Precision Medicine Market
12.16.3 Financials
12.16.4 SWOT Analysis
12.17 Laboratory Corporation of America Holdings
12.17.1 Company Overview
12.17.2 Role of Laboratory Corporation of America Holdings in Global Non-Oncology Precision Medicine Market
12.17.3 Financials
12.17.4 SWOT Analysis
12.18 OPKO Health, Inc.
12.18.1 Company Overview
12.18.2 Role of OPKO Health, Inc. in Global Non-Oncology Precision Medicine Market
12.18.3 Financials
12.18.4 SWOT Analysis
12.19 Partek, Inc.
12.19.1 Company Overview
12.19.2 Role Partek, Inc. in Global Non-Oncology Precision Medicine Market
12.19.3 SWOT Analysis
12.20 Quest Diagnostics
12.20.1 Company Overview
12.20.2 Role of Quest Diagnostics in Global Non-Oncology Precision Medicine Market
12.20.3 Financials
12.20.4 SWOT Analysis
12.21 QIAGEN N.V.*
12.21.1 Company Overview
12.21.2 Role of QIAGEN N.V. in Global Non-Oncology Precision Medicine Market
12.21.3 Financials
12.21.4 SWOT Analysis
12.22 Randox Laboratories Ltd.
12.22.1 Company Overview
12.22.2 Role of Randox Laboratories Ltd. in Global Non-Oncology Precision Medicine Market
12.22.3 SWOT Analysis
12.23 Sanofi S.A.
12.23.1 Company Overview
12.23.2 Role of Sanofi SA in Global Non-Oncology Precision Medicine Market
12.23.3 Financials
12.23.4 SWOT Analysis
12.24 Teva Pharmaceuticals Industries Ltd.
12.24.1 Company Overview
12.24.2 Role of Teva Pharmaceuticals Industries Ltd. in Global Non-Oncology Precision Medicine Market
12.24.3 Financials
12.24.4 SWOT Analysis
12.25 Thermo Fisher Scientific Inc.
12.25.1 Company Overview
12.25.2 Role of Thermo Fisher Scientific Inc. in Global Non-Oncology Precision Medicine Market
12.25.3 Financials
12.25.4 SWOT Analysis
Table 4.1: Successful Non-Oncology Precision Medicine Interventions
Table 7.1: Percentage of Total Regional Aged Population (65 Years and Above: 2015 and 2030)
Table 9.1: FDA Approved Personalized Drugs Launched, Infectious Diseases, 2015-2019
Table 9.2: FDA Approved Personalized Drugs Launched, Neurology, 2015-2019
Table 9.3: FDA Approved Personalized Drugs Launched, Cardiology, 2015-2019
Table 9.4: FDA Approved Personalized Drugs Launched, Gastroenterology, 2015-2019
Table 9.5: FDA Approved Personalized Drugs Launched, Other Diseases, 2015-2019
Figure 1: Share of FDA Approved Non-Oncology Precision Medicine Drugs (2016-2018)
Figure 2: Global Non-Oncology Precision Medicine Market, 2019-2030
Figure 3: Market Drivers, Opportunities, and Restraints
Figure 4: Share of Key Developments and Strategies, by Company (January 2016-August 2020)
Figure 5: Growth-Share Matrix for Global Non-Oncology Precision Medicine Market (by Company), 2019
Figure 6: Global Non-Oncology Precision Medicine Applications Market Share (Application Type), 2019-2030
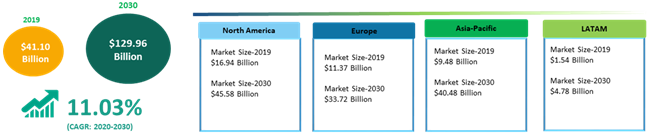
Figure 7: Global Non-Oncology Precision Medicine Market (by Region)
Figure 2.1: Global Non-Oncology Precision Medicine Market Segmentation
Figure 3.1: Global Non-Oncology Precision Medicine Market Research Methodology
Figure 3.2: Primary Research Methodology
Figure 3.3: Bottom-Up Approach (Segment-Wise Analysis)
Figure 3.4: Share of Total Number of Companies Profiled
Figure 4.1: Precision Medicine Model
Figure 4.2: Global Non-Oncology Precision Medicine Market, 2019-2030
Figure 4.3: Enabling Technologies of Precision Medicine
Figure 4.4: Potential of Precision Medicine
Figure 5.1: Pre-COVID-19 and Post-COVID-19 Scenario of Global Non-Oncology Precision Medicine Market, 2017-2025
Figure 5.2: Supply Chain of Non-Oncology Precision Medicine
Figure 5.3: Key Factors of Supply Chain
Figure 5.4: Measures to Bridge the Supply-Chain Gap in Non-Oncology Precision Medicine Market
Figure 6.1: Share of Patents Assigned (2015-2019)
Figure 6.2: Total Number of Patents Assigned to Key Technologies, 2016-2018
Figure 7.1: Impact Analysis of Market Dynamics
Figure 7.2: Percentage of Patients With Experience of Ineffective Drug Treatment
Figure 7.3: Steady Increase in Usage of Personalized Medicine
Figure 8.1: Share of Key Developments and Strategies, January 2016-August 2020
Figure 8.2: Share of Product Offerings, January 2016-August 2020
Figure 8.3: Share of Partnerships and Alliances, January 2016-August 2020
Figure 8.4: Share of Funding and Investment, January 2016-August 2020
Figure 8.5: Share of Mergers and Acquisitions, January 2016-August 2020
Figure 8.6: Share of Funding and Investments, January 2016-August 2020
Figure 8.7: Market Share Analysis: Global Non-Oncology Precision Medicine Market, 2019
Figure 8.8: Growth-Share Matrix for Global Non-Oncology Precision Medicine Market (by Company), 2019
Figure 9.1: Global Non-Oncology Precision Medicine Applications Market Share (Application Type), 2019-2030
Figure 9.2: Global Non-Oncology Precision Medicine Infectious Diseases Market, 2019-2030
Figure 9.3: Global on-Oncology Precision Medicine Market (for Respiratory Infections), 2019-2030
Figure 9.4: Global on-Oncology Precision Medicine Market (for Gastrointestinal Infections), 2019-2030
Figure 9.5: Global on-Oncology Precision Medicine Market (by Sexually Transmitted Infections), 2019-2030
Figure 9.6: Global on-Oncology Precision Medicine Market (for Other Infections), 2019-2030
Figure 9.7: Global Non-Oncology Precision Medicine Neurology Market, 2019-2030
Figure 9.8: Global on-Oncology Precision Medicine Market (for Neurodegenerative Disorders), 2019-2030
Figure 9.9: Global on-Oncology Precision Medicine Market (for Neuropsychiatric Disorders), 2019-2030
Figure 9.10: Global Non-Oncology Precision Medicine Market (for Other Neurology Disorders), 2019-2030
Figure 9.11: Global Non-Oncology Precision Medicine Lifestyle and Endocrinology Market, 2019-2030
Figure 9.12: Global Non-Oncology Precision Medicine Cardiovascular Market, 2019-2030
Figure 9.13: Global on-Oncology Precision Medicine Market (for Cardiac Myopathies and Arrhythmia), 2019-2030
Figure 9.14: Global Oncology Precision Medicine Market (by Other Cardiovascular Disorder), 2019-2030
Figure 9.15: Global Non-Oncology Precision Medicine Gastroenterology Market, 2019-2030
Figure 9.16: Global Non-Oncology Precision Medicine Other Applications Market, 2019-2030
Figure 10.1: Global Non-Oncology Precision Medicine Market (by Applied Sciences), 2019-2030
Figure 10.2: Global Non-Oncology Precision Medicine Applied Sciences Market Share (by Type), 2019-2030
Figure 10.3: Global Non-Oncology Precision Medicine Genomics Market, 2019-2030
Figure 10.4: Global Non-Oncology Precision Medicine Genomics Market Share (by Technology)
Figure 10.5: Global Non-Oncology Precision Medicine PCR Market, 2019-2030
Figure 10.6: Global Non-Oncology Precision Medicine NGS Market, 2019-2030
Figure 10.7: Global Non-Oncology Precision Medicine Genome Editing Market, 2019-2030
Figure 10.8: Global Non-Oncology Precision Medicine Other Technologies Market, 2019-2030
Figure 10.9: Global Non-Oncology Precision Medicine Pharmacogenomics Market, 2019-2030
Figure 10.10: Global Non-Oncology Precision Medicine Other Applied Sciences Market, 2019-2030
Figure 10.11: Global Non-Oncology Precision Medicine Market (by Precision Diagnostics)
Figure 10.12: Global Non-Oncology Precision Medicine Market (by Precision Diagnostics), 2019-2030
Figure 10.13: Global Non-Oncology Precision Medicine Diagnostics Market Share (by Type), 2019-2030
Figure 10.14: Global Non-Oncology Precision Medicine Molecular Diagnostics Market, 2019-2030
Figure 10.15: Global Non-Oncology Precision Medicine Medical Imaging Market, 2019-2030
Figure 10.16: Global Non-Oncology Precision Medicine Digital Health and Information Technology Market,2019-2030
Figure 10.17: Global Non-Oncology Precision Medicine Digital Health and Information Technology Market Share (by Type), 2019-2030
Figure 10.18: Global Non-Oncology Precision Medicine CDSS Market, 2019-2030
Figure 10.19: Global Non-Oncology Precision Medicine Big Data Analytics Market, 2019-2030
Figure 10.20: Global Non-Oncology Precision Medicine IT Infrastructure Market, 2019-2030
Figure 10.21: Global Non-Oncology Precision Medicine Genomics Informatics Market, 2019-2030
Figure 10.22: Global Non-Oncology Precision Medicine In-Silico Informatics Market, 2019-2030
Figure 10.23: Global Non-Oncology Precision Medicine Mobile Health Market, 2019-2030
Figure 10.24: Global Non-Oncology Precision Medicine Therapeutics Market, 2019-2030
Figure 10.25: Global Non-Oncology Precision Medicine Therapeutics Market Share (by Type), 2019-2030
Figure 10.26: Global Non-Oncology Precision Medicine Clinical Trials Market, 2019-2030
Figure 10.27: Global Non-Oncology Precision Medicine Cell Therapy Market, 2019-2030
Figure 10.28: Global Non-Oncology Precision Medicine Drug Discovery and Research Market, 2019-2030
Figure 10.29: Global Non-Oncology Precision Medicine Gene Therapy Market, 2019-2030
Figure 11.1: Global Non-Oncology Precision Medicine Market (by Region)
Figure 11.2: North America Global Non-Oncology Precision Medicine Market, 2019-2030
Figure 11.3: North America: Market Dynamics
Figure 11.4: North America Global Non-Oncology Precision Medicine Market (by Country), 2019-2030
Figure 11.5: U.S. Non-Oncology Precision Medicine Market, 2019-2030
Figure 11.6: Canada Non-Oncology Precision Medicine Market, 2019-2030
Figure 11.7: Europe Non-Oncology Precision Medicine Market, 2019-2030
Figure 11.8: Europe: Market Dynamics
Figure 11.9: Europe Non-Oncology Precision Medicine Market (by Country), 2019-2030
Figure 11.10: Germany Non-Oncology Precision Medicine Market, 2019-2030
Figure 11.11: France Non-Oncology Precision Medicine Market, 2019-2030
Figure 11.12: Italy Non-Oncology Precision Medicine Market, 2019-2030
Figure 11.13: The U.K. Non-Oncology Precision Medicine Market, 2019-2030
Figure 11.14: Spain Non-Oncology Precision Medicine Market, 2019-2030
Figure 11.15: Rest-of-Europe Non-Oncology Precision Medicine Market, 2019-2030
Figure 11.16: Asia-Pacific Non-Oncology Precision Medicine Market, 2019-2030
Figure 11.17: Asia-Pacific: Market Dynamics
Figure 11.18: Asia-Pacific Non-Oncology Precision Medicine Market (by Country), 2019-2030
Figure 11.19: China Non-Oncology Precision Medicine Market, 2019-2030
Figure 11.20: Japan Non-Oncology Precision Medicine Market, 2019-2030
Figure 11.21: Australia Non-Oncology Precision Medicine Market, 2019-2030
Figure 11.22: India Non-Oncology Precision Medicine Market, 2019-2030
Figure 11.23: Rest-of-Asia-Pacific Non-Oncology Precision Medicine Market, 2019-2030
Figure 11.24: Latin America Non-Oncology Precision Medicine Market, 2019-2030
Figure 11.25: Latin America: Market Dynamics
Figure 11.26: Latin America Global Non-Oncology Precision Medicine Market (by Country), 2019 and 2030
Figure 11.27: Brazil Non-Oncology Precision Medicine Market, 2019-2030
Figure 11.28: Mexico Non-Oncology Precision Medicine Market, 2019-2030
Figure 11.29: Mexico Non-Oncology Precision Medicine Market, 2019-2030
Figure 11.30: Rest-of-the-World Non-Oncology Precision Medicine Market, 2019-2030
Figure 12.1: Abbott Laboratories.: Overall Product Offerings
Figure 12.2: Abbott Laboratories: Overall Financials, 2017-2019
Figure 12.3: Abbott Laboratories: Net Revenue (by Business Segment), 2017-2019
Figure 12.4: Abbott Laboratories: Net Revenue (by Region), 2017-2019
Figure 12.5: Abbott Laboratories: Research and Development Expense, 2017-2019
Figure 12.6: Abbott Laboratories: SWOT Analysis
Figure 12.7: Agilent Technologies, Inc.: Overall Product Offerings
Figure 12.8: Agilent Technologies, Inc.: Overall Financials, 2017-2019
Figure 12.9: Agilent Technologies, Inc.: Net Revenue (by Business Segment), 2017-2019
Figure 12.10: Agilent Technologies, Inc.: Revenue (by Region), 2017-2019
Figure 12.11: Agilent Technologies, Inc.: Research and Development Expense, 2017-2019
Figure 12.12: Agilent Technologies, Inc.: SWOT Analysis
Figure 12.13: Almac Group Ltd.: Overall Product Offerings
Figure 12.14: Almac Group Ltd.: SWOT Analysis
Figure 12.15: Astra Zeneca: Overall Product Portfolio
Figure 12.16: Astra Zeneca: Overall Financials, 2017-2019
Figure 12.17: Astra Zeneca: Revenue (by Business Segment), 2017-2019
Figure 12.18: Astra Zeneca: Revenue (by Region), 2017-2019
Figure 12.19: Astra Zeneca: SWOT Analysis
Figure 12.20: ASURAGEN, INC.: Overall Product Offerings
Figure 12.21: ASURAGEN INC.: SWOT Analysis
Figure 12.22: BGI Group.: Overall Product Portfolio
Figure 12.23: BGI Group: SWOT Analysis
Figure 12.24: Bio-Rad Laboratories, Inc: Overall Product Offerings
Figure 12.25: Bio-Rad Laboratories, Inc: Overall Financials, 2017-2019
Figure 12.26: Bio-Rad Laboratories, Inc: Revenue (by Business Segment), 2017-2019
Figure 12.27: Bio-Rad Laboratories, Inc: Revenue (by Region), 2017-2019
Figure 12.28: Bio-Rad Laboratories, Inc. R&D Expenditure, 2017-2019
Figure 12.29: Bio-Rad Laboratories, Inc.: SWOT Analysis
Figure 12.30: bioMérieux S.A.: Overall Product Portfolio
Figure 12.31: bioMérieux S.A.: Overall Financials, 2017-2019
Figure 12.32: bioMérieux S.A.: Revenue (by Segment), 2017-2019
Figure 12.33: bioMérieux S.A.: Revenue (by Region), 2018 and 2019
Figure 12.34: bioMérieux S.A.: SWOT Analysis
Figure 12.35: Bristol-Myers Squibb Company: Overall Product Portfolio
Figure 12.36: Bristol-Myers Squibb Company: Overall Financials, 2017-2019
Figure 12.37: Bristol-Myers Squibb Company R&D Expenditure, 2017-2019
Figure 12.38: Bristol-Myers Squibb Company: SWOT Analysis
Figure 12.39: Danaher Corporation: Overall Product Portfolio
Figure 12.40: Danaher Corporation: Overall Financials, 2017-2019
Figure 12.41: Danaher Corporation: Revenue (by Business Segment), 2017-2019
Figure 12.42: Danaher Corporation: SWOT Analysis
Figure 12.43: F. Hoffmann-La Roche Ltd: Product Portfolio
Figure 12.44: F. Hoffmann-La Roche Ltd: Overall Financials, 2017-2019
Figure 12.45: F. Hoffmann-La Roche Ltd: Revenue (by Segment), 2017-2019
Figure 12.46: Hoffmann-La Roche Ltd: Revenue (by Region), 2017-2019
Figure 12.47: F. Hoffmann-La Roche Ltd: R&D Expenditure, 2017-2019
Figure 12.48: F. Hoffmann-La Roche Ltd: SWOT Analysis
Figure 12.49: Gilead Sciences, Inc.: Overall Product Portfolio
Figure 12.50: Gilead Sciences, Inc.: Overall Financials, 2017-2019
Figure 12.51: Gilead Sciences, Inc. : R&D Expenditure, 2017-2019
Figure 12.52: Gilead Science, Inc.: SWOT Analysis
Figure 12.53: GlaxoSmithKline Plc.: Overall Product Portfolio
Figure 12.54: GlaxoSmithKline plc: Overall Financials, 2017-2019
Figure 12.55: GlaxoSmithKline plc: Revenue (by Segment), 2017-2019
Figure 12.56: GlaxoSmithKline plc: Revenue (by Region), 2017-2019
Figure 12.57: GlaxoSmithKline plc: R&D Expenditure, 2017-2019
Figure 12.58: GlaxoSmithKline plc: SWOT Analysis
Figure 12.59: Invitae Corporation: Overall Product Portfolio
Figure 12.60: Invitae Corporation: Overall Financials, 2017-2019
Figure 12.61: Invitae Corporation: Revenue (by Segment), 2017-2019
Figure 12.62: Invitae Corporation: Revenue (by Region), 2017-2019
Figure 12.63: Invitae Corporation: R&D Expenditure, 2017-2019
Figure 12.64: Invitae Corporation: SWOT Analysis
Figure 12.65: Illumina, Inc.: Overall Product Portfolio
Figure 12.66: Illumina, Inc.: Overall Financials, 2017-2019
Figure 12.67: Illumina, Inc.: Revenue (by Segment), 2017-2019
Figure 12.68: Illumina, Inc.: Revenue (by Region), 2017-2019
Figure 12.69: Illumina, Inc.: R&D Expenditure, 2017-2019
Figure 12.70: Illumina, Inc.: SWOT Analysis
Figure 12.71: Konica Minolta, Inc.: Overall Product Portfolio
Figure 12.72: Konica Minolta, Inc.: Overall Financials, 2017-2019
Figure 12.73: Konica Minolta, Inc.: Revenue (by Region), 2017-2019
Figure 12.74: Konica Minolta, Inc.: Research and Development Expense, 2017-2019
Figure 12.75: Konica Minolta, Inc.: SWOT Analysis
Figure 12.76: Laboratory Corporation of America Holdings.: Overall Product Portfolio
Figure 12.77: Laboratory Corporation of America Holdings: Overall Financials, 2017-2019
Figure 12.78: Laboratory Corporation of America Holdings: Revenue (by Segment), 2017-2019
Figure 12.79: Laboratory Corporation of America Holdings: Revenue (by Region), 2019
Figure 12.80: Laboratory Corporation of America Holdings: SWOT Analysis
Figure 12.81: OPKO Health, Inc.: Overall Product Portfolio
Figure 12.82: OPKO Health, Inc.: Overall Financials, 2017-2019
Figure 12.83: OPKO Health, Inc: Net Revenue (by Business Segment), 2017-2019
Figure 12.84: OPKO Health, Inc.: Net Revenue (by Region), 2017-2019
Figure 12.85: OPKO Health, Inc.: Research and Development Expense, 2017-2019
Figure 12.86: OPKO Health, Inc.: SWOT Analysis
Figure 12.87: Partek, Inc: Overall Product Portfolio
Figure 12.88: Partek, Inc.: SWOT Analysis
Figure 12.89: Quest Diagnostics Incorporated: Overall Product Offerings
Figure 12.90: Quest Diagnostics Incorporated: Overall Financials, 2017-2019
Figure 12.91: Quest Diagnostics Incorporated: Revenue (by Business Segment), 2017-2019
Figure 12.92: Quest Diagnostics Incorporated: SWOT Analysis
Figure 12.93: QIAGEN N.V.: Overall Product Portfolio
Figure 12.94: QIAGEN N.V.: Overall Financials, 2017-2019
Figure 12.95: QIAGEN N.V.: Revenue (by Segment), 2017-2019
Figure 12.96: QIAGEN N.V.: Revenue (by Region), 2017-2019
Figure 12.97: QIAGEN N.V.: R&D Expenditure, 2017-2019
Figure 12.98: QIAGEN N.V.: SWOT Analysis
Figure 12.99: Randox Laboratories Ltd.: SWOT Analysis
Figure 12.100: Sanofi SA: Overall Product Portfolio
Figure 12.101: Sanofi SA: Overall Financials, 2017-2019
Figure 12.102: Sanofi SA: Revenue (by Segment), 2017-2019
Figure 12.103: Sanofi SA: Revenue (by Region), 2017-2019
Figure 12.104: Sanofi SA: R&D Expenditure, 2017-2019
Figure 12.105: Sanofi SA: SWOT Analysis
Figure 12.106: Teva Pharmaceuticals Industries Ltd.: Overall Product Portfolio
Figure 12.107: Teva Pharmaceuticals Industries Ltd.: Overall Financials, 2017-2019
Figure 12.108: Teva Pharmaceuticals Industries Ltd.: Revenue (by Region), 2017-2019
Figure 12.109: Teva Pharmaceuticals Industries Ltd. R&D Expenditure, 2017-2019
Figure 12.110: Teva Pharmaceuticals Industries Ltd.: SWOT Analysis
Figure 12.111: Thermo Fisher Scientific Inc.: Overall Product Portfolio
Figure 12.112: Thermo Fisher Scientific Inc.: Overall Financials, 2017-2019
Figure 12.113: Thermo Fisher Scientific Inc.: Revenue (by Segment), 2017-2019
Figure 12.114: Thermo Fisher Scientific Inc.: Revenue (by Region), 2017-2019
Figure 12.115: Thermo Fisher Scientific Inc.: R&D Expenditure, 2017-2019
Figure 12.116: Thermo Fisher Scientific Inc.: SWOT Analysis
Report Description
Market Report Coverage - Non-Oncology Precision Medicine |
|||
Base Year |
2019 |
Market Size in 2019 |
$41.1 Billion |
Forecast Period |
2020-2030 |
Value Projection and Estimation by 2030 |
$129.96 Billion |
CAGR During Forecast Period |
11.03% |
Number of Tables |
7 |
Number of Pages |
306 |
Number of Figures |
224 |
Research Hours |
|
|
|
Market Segmentation |
• By Application: Infectious Diseases, Neurology, Cardiovascular, Lifestyle and Endocrinology, Gastroenterology, Other Applications • By Ecosystem: Applied Sciences, Precision Diagnostics, Digital Health and Information Technology, Precision Therapeutics • By Region: North America, Europe, Asia-Pacific, Latin America, and Rest-of-the-World |
||
Regional Segmentation |
• North America – Country Specific Stratification • Europe – Country Specific Stratification • Asia-Pacific – Country Specific Stratification • Latin America – Country Specific Stratification • Rest-of-the-World |
||
Growth Drivers |
• Improved availability of targeted therapies and decreasing trial and error-based prescription • Reduced chances of adverse drug reactions • Decreasing overall cost of genome sequencing • Rising prevalence of chronic diseases |
||
Market Challenges |
• Unclear regulatory framework and reimbursement scenario for personalized medicine • Limited knowledge about molecular mechanism/interaction • Integrating and securing Electronic Health Record |
||
Market Opportunities |
• Research alliance across industry and academia would accelerate the market entry • Strong product pipeline and increasing FDA approvals |
||
Key Non-Oncology Precision Medicine Companies Profiled |
Abbott Laboratories, Agilent Technologies, Inc., Asuragen, Inc., Almac Group, AstraZeneca PLC, Bristol Myers Squibb, bioMérieux SA., BGI, Bio-Rad Laboratories, Inc F. Hoffmann-La Roche AG, Danaher Corp., GlaxoSmithKline plc., Gilead Sciences, Inc. Illumina, Inc., Invitae Corporation, Opko Health, Inc., Laboratory Corporation of America Holdings, Pacific Biosciences of California, Inc., Partek Incorporated, Randox Laboratorie, Teva Pharmaceutical Industries Ltd., Thermofisher Scientific, QIAGEN, and Quest Diagnostics |
Key Questions Answered in this Report:
• What are the various types of technologies available in the non-oncology precision medicine market, and what are the benefits offered by them?
• What are the key development strategies implemented by the key players to stand out in this market?
• What are the emerging technologies that can take over the current technologies for molecular diagnosis within the non-oncology precision medicine market?
• How have the strategic collaborations among the key players and academia provided a push to product development within the non-oncology precision medicine market?
• Which technology has witnessed maximum adoption in terms of patent filing and development of molecular therapeutics within the market, and why?
• What are the regulations pertaining to the global non-oncology precision medicine market in different regions?
• What are the initiatives implemented by different government bodies regulating the development and commercialization of non-oncology precision medicine products and associated platforms?
• How has COVID-19 impacted the non-oncology precision medicine market?
• How will the urgency of the pandemic influence the global non-oncology precision medicine market?
• What are the leading companies dominating the global non-oncology precision medicine market?
• What are the significant research and developmental investments performed by the key market players?
• What is the reimbursement scenario of the products offered in the global non-oncology precision medicine market?
• Based on the application area, which global non-oncology precision medicine market application area is anticipated to witness a massive rise in demand in the forecast period?
• How is each segment of the global non-oncology precision medicine market expected to grow during the forecast period, and what is the revenue expected to be generated by each of the segments by the end of 2030?
Market Overview
The precision medicine approach is used for several disease management, such as oncology, immunology, neurology, and infectious diseases. In the non-oncology precision medicine market, the application of molecular biology is for studying the cause of a patient's disease at the molecular level for diseases other than cancer, so that target-based therapies or individualized therapies can be applied to cure the patient's health-related problems.
The global non-oncology precision medicine market was valued at $41.1 in 2019, and it is expected to grow at an impressive double-digit rate of 11.03% and reach a value of $129.96 in 2030.
Figure: Global Non-Oncology Precision Medicine Market Snapshot
Source: BIS Research Analysis
The existing non-oncology precision medicine market is favored by multiple factors, which include rising government initiatives, coupled up with the general population’s growing awareness pertaining to molecular level diagnosis and treatment. Additionally, the increasing number of advancements in molecular diagnostics, more key players interested in investing for the development of novel personalized therapies, and increasing FDA approvals for such drugs among others.
Within the research report, the market is segmented on the basis of application (infectious diseases, neurology, cardiovascular, lifestyle and endocrinology, gastroenterology, other applications), ecosystem type (applied sciences, precision diagnostics, digital health and information technology, precision therapeutics), and region (North America, Europe, Asia Pacific, Latin America, and Rest-of-the-World). This segmentation highlights value propositions and business models useful for industry leaders and stakeholders. The research also comprises country-level analysis, go-to-market strategies of leading players, future opportunities, among others, to detail the scope and provide a 360-coverage of the domain.
Competitive Landscape
The non-oncology precision medicine market witnessed 59 collaborations and partnerships, four fundings and investments, 44 product launches and enhancements,26 regulatory and legal activities,18 mergers and acquisitions, and six business expansions during the period January 2016-August 2020.
Major players within the non-oncology precision medicine market are Abbott Laboratories, Agilent Technologies, Inc., Asuragen, Inc., Almac Group, AstraZeneca PLC, Bristol Myers Squibb, bioMérieux SA., BGI, Bio-Rad Laboratories, Inc F. Hoffmann-La Roche AG, Danaher Corp., GlaxoSmithKline plc., Gilead Sciences, Inc. Illumina, Inc., Invitae Corporation, Opko Health, Inc., Laboratory Corporation of America Holdings, Pacific Biosciences of California, Inc., Partek Incorporated, Randox Laboratorie, Teva Pharmaceutical Industries Ltd., Thermofisher Scientific, QIAGEN, and Quest Diagnostics.
Global Non-Oncology Precision Medicine Market
Focus on Application Area, Ecosystem Type, Country Data (15 Countries) - Analysis and Forecast, 2020-2030
Frequently Asked Questions
Answer: The global non-oncology precision medicine market was estimated at $41.1 Billion in 2019 and is projected to grow at a CAGR of 11.03% during the forecast period, 2020-2030.
Answer: The impact of COVID-19 on non-oncology precision medicine market has been such that it has resulted in the unprecedented demand for non-oncology precision medicine along with affecting the supply chain of non-oncology precision medicine-based therapies.
Answer: The key development strategies that companies are opting for include product offerings, partnerships and alliances, regulatory and legal, mergers and acquisitions, and funding and investments. Among all these strategies partnerships and alliances as a strategy is the most preferred strategy.
Answer: Non-Oncology precision medicine can be used for infectious diseases, neurology, lifestyle and endocrinology, cardiovascular, gastroenterology, and others diseases.
Answer: There are several companies operating in the market. Some of the major organizations include Abbott Laboratories, Agilent Technologies, Inc., Asuragen, Inc., F. Hoffmann-La Roche AG, Danaher Corp., GlaxoSmithKline plc., Gilead Sciences, Inc. Illumina, Inc., Thermofisher Scientific, QIAGEN, and Quest Diagnostics.