Published Year: 2019
Global Plant-Based Food & Beverages Alternatives Market – Analysis and Forecast, 2019-2024: Focus
The global plant-based food and beverage alternatives market to grow at a significant CAGR of...
Focus on Product Offering, Technology, Application, Farm Produce, Patent, Government Programs and Funding - Analysis and Forecast, 2020-2025
Delivery Time: 1-5 Working Days
Get ISO Certified Research, Customization, Data Extraction, and Value-Added Services with All BIS Research Reports
BIS Research provides a comprehensive report library with unlimited access to data, insights, and market intelligence through Subscription.
Get Subscription Know More
1.1 Industry Outlook
1.1.1 Government Programs and Initiatives Landscape
1.1.1.1 North America
1.1.1.2 Europe
1.1.1.3 U.K.
1.1.1.4 Asia-Pacific and Japan
1.1.1.5 China
1.1.1.6 Rest-of-the-World
1.1.2 Regulatory Landscape
1.1.2.1 North America
1.1.2.2 Europe
1.1.2.3 U.K.
1.1.2.4 South America
1.1.2.5 Asia-Pacific and Japan
1.1.2.6 China
1.1.2.7 Middle East and Africa
1.1.3 Key Consortium and Associations
1.1.4 Investment and Funding Landscape
1.1.5 Patent Analysis
1.1.5.1 Overview
1.1.5.2 Patent Analysis (by Status)
1.1.5.3 Patent Analysis (by Applicant Profile)
1.1.5.4 Patent Analysis (by Company)
1.1.5.5 Patent Analysis (by Technology)
1.1.5.6 Patent Analysis (by Patent Office)
1.1.6 Industry Attractiveness
1.1.6.1 Threat of New Entrants
1.1.6.2 Bargaining Power of Buyers
1.1.6.3 Bargaining Power of Suppliers
1.1.6.4 Threat from Substitutes
1.1.6.5 Intensity of Competitive Rivalry
1.2 Business Dynamics
1.2.1 Business Drivers
1.2.1.1 Rising Need for Improved Crop Traits
1.2.1.2 Increasing Need to Reduce Crop Losses
1.2.1.3 Reducing Cost of DNA Sequencing and Synthesizing
1.2.2 Business Challenges
1.2.2.1 High Initial Deployment Cost
1.2.2.2 Lack of Awareness in Handling Modern Plant Genomics Technologies in Developing Countries
1.2.3 Business Opportunities
1.2.3.1 Favorable Government Initiatives to Support Research and Development
1.2.3.2 Increasing Opportunities for Using Next-Generation Sequencing Technologies
1.2.4 Business Strategies
1.2.4.1 Product Developments
1.2.4.2 Market Developments
1.2.5 Corporate Strategies
1.2.5.1 Mergers and Acquisitions
1.2.5.2 Partnerships, Collaboration and Joint Ventures
2.1 Global Plant Genomics Market (by Application), Applications and Specifications
2.1.1 Herbicide Tolerance
2.1.2 Disease Resistance
2.1.3 Yield Improvement
2.1.4 Others
2.2 Global Plant Genomics Market, Demand Analysis (by Application)
2.2.1 Demand Analysis (by Application), Value Data, 2019-2025
2.2.1.1 Yield Improvement
2.2.1.2 Disease Resistance
2.2.1.3 Herbicide Tolerance
2.2.1.4 Others
2.3 Global Plant Genomics Market (by Farm Produce), Application and Specifications
2.3.1 Cereals
2.3.2 Oil Crops
2.3.3 Fiber Crops
2.3.4 Pulses
2.3.5 Fruits
2.3.6 Vegetables
2.3.7 Tree Nuts
2.3.8 Roots and Tubers
2.4 Global Plant Genomics Market, Demand Analysis (by Farm Produce)
2.4.1 Demand Analysis (by Farm Produce), Value, 2019-2025
2.4.1.1 Cereals
2.4.1.2 Oil Crops
2.4.1.3 Fiber Crops
2.4.1.4 Pulses
2.4.1.5 Fruits
2.4.1.6 Roots and Tubers
2.4.1.7 Vegetables
2.4.1.8 Tree Nuts
3.1 Global Plant Genomics Market (by Product Offering), Product and Specification
3.1.1 Hardware Devices
3.1.2 Software/Platform
3.1.3 Support Services
3.2 Global Plant Genomics Market, Demand Analysis (by Product Offering)
3.2.1 Demand Analysis (by Product Offering), Value Data, 2019-2025
3.2.1.1 Hardware Devices
3.2.1.2 Software/Platform
3.2.1.3 Support Services
3.3 Global Plant Genomics Market (by Technology), Product and Specification
3.3.1 DNA/RNA Sequencing
3.3.2 Genotyping
3.3.3 Marker-Assisted Selection (MAS)
3.3.4 Bioinformatics
3.3.5 Others
3.4 Global Plant Genomics Market, Demand Analysis (by Technology)
3.4.1 Demand Analysis (by Technology), Value Data, 2019-2025
3.4.1.1 DNA/RNA Sequencing
3.4.1.2 Genotyping
3.4.1.3 Marker-Assisted Selection
3.4.1.4 Bioinformatics
3.4.1.5 Others
4.1 North America
4.1.1 Market
4.1.1.1 Key Players in North America
4.1.1.2 Business Drivers
4.1.1.3 Business Challenges
4.1.2 Application
4.1.2.1 North America Plant Genomics Market (by Application), Value Data
4.1.3 Product
4.1.3.1 North America Plant Genomics Market (by Technology), Value Data
4.1.4 North America (by Country)
4.1.4.1 U.S.
4.1.4.1.1 Markets
4.1.4.1.1.1 Buyer Attributes
4.1.4.1.1.2 Key Players in the U.S.
4.1.4.1.1.3 Business Challenges
4.1.4.1.1.4 Business Drivers
4.1.4.1.2 Application
4.1.4.1.2.1 U.S. Plant Genomics Market (by Application), Value Data
4.1.4.1.3 Product
4.1.4.1.3.1 U.S. Plant Genomics Market (by Technology), Value Data
4.1.4.2 Canada
4.1.4.2.1 Markets
4.1.4.2.1.1 Buyer Attributes
4.1.4.2.1.2 Key Players in Canada
4.1.4.2.1.3 Business Challenges
4.1.4.2.1.4 Business Drivers
4.1.4.2.2 Application
4.1.4.2.2.1 Canada Plant Genomics Market (by Application), Value Data
4.1.4.2.3 Product
4.1.4.2.3.1 Canada Plant Genomics Market (by Technology), Value Data
4.1.4.3 Mexico
4.1.4.3.1 Markets
4.1.4.3.1.1 Buyer Attributes
4.1.4.3.1.2 Key Players in Mexico
4.1.4.3.1.3 Business Challenges
4.1.4.3.1.4 Business Drivers
4.1.4.3.2 Application
4.1.4.3.2.1 Mexico Plant Genomics Market (by Application), Value Data
4.1.4.3.3 Product
4.1.4.3.3.1 Mexico Plant Genomics Market (by Technology), Value Data
4.2 South America
4.2.1 Markets
4.2.1.1 Key Players in South America
4.2.1.2 Business Drivers
4.2.1.3 Business Challenges
4.2.2 Application
4.2.2.1 South America Plant Genomics Market (by Application), Value Data
4.2.3 Product
4.2.3.1 South America Plant Genomics Market (by Technology), Value Data
4.2.4 South America (by Country)
4.2.4.1 Brazil
4.2.4.1.1 Markets
4.2.4.1.1.1 Buyer Attributes
4.2.4.1.1.2 Key Players in Brazil
4.2.4.1.1.3 Business Challenges
4.2.4.1.1.4 Business Drivers
4.2.4.1.2 Application
4.2.4.1.2.1 Brazil Plant Genomics Market (by Application), Value Data
4.2.4.1.3 Product
4.2.4.1.3.1 Brazil Plant Genomics Market (by Technology), Value Data
4.2.4.2 Argentina
4.2.4.2.1 Markets
4.2.4.2.1.1 Buyer Attributes
4.2.4.2.1.2 Key Players in Argentina
4.2.4.2.1.3 Business Challenges
4.2.4.2.1.4 Business Drivers
4.2.4.2.2 Application
4.2.4.2.2.1 Argentina Plant Genomics Market (by Application), Value Data
4.2.4.2.3 Product
4.2.4.2.3.1 Argentina Plant Genomics Market (by Technology), Value Data
4.2.4.3 Chile
4.2.4.3.1 Markets
4.2.4.3.1.1 Buyer Attributes
4.2.4.3.1.2 Key Players in Chile
4.2.4.3.1.3 Business Challenges
4.2.4.3.1.4 Business Drivers
4.2.4.3.2 Application
4.2.4.3.2.1 Chile Plant Genomics Market (by Application), Value Data
4.2.4.3.3 Product
4.2.4.3.3.1 Chile Plant Genomics Market (by Technology), Value Data
4.2.4.4 Rest-of-South America
4.2.4.4.1 Markets
4.2.4.4.1.1 Buyer Attributes
4.2.4.4.1.2 Key Players in Rest-of-South America
4.2.4.4.1.3 Business Challenges
4.2.4.4.1.4 Business Drivers
4.2.4.4.2 Application
4.2.4.4.2.1 Rest-of-South America Plant Genomics Market (by Application), Value Data
4.2.4.4.3 Product
4.2.4.4.3.1 Rest-of-South America Plant Genomics Market (by Technology), Value Data
4.3 Europe
4.3.1 Markets
4.3.1.1 Key Players in Europe
4.3.1.2 Business Drivers
4.3.1.3 Business Challenges
4.3.2 Application
4.3.2.1 Europe Plant Genomics Market (by Application), Value Data
4.3.3 Product
4.3.3.1 Europe Plant Genomics Market (by Technology), Value Data
4.3.4 Europe (by Country)
4.3.4.1 Germany
4.3.4.1.1 Markets
4.3.4.1.1.1 Buyer Attributes
4.3.4.1.1.2 Key Players in Germany
4.3.4.1.1.3 Business Challenges
4.3.4.1.1.4 Business Drivers
4.3.4.1.2 Application
4.3.4.1.2.1 Germany Plant Genomics Market (by Application), Value Data
4.3.4.1.3 Product
4.3.4.1.3.1 Germany Plant Genomics Market (by Technology), Value Data
4.3.4.2 France
4.3.4.2.1 Markets
4.3.4.2.1.1 Buyer Attributes
4.3.4.2.1.2 Key Players in France
4.3.4.2.1.3 Business Challenge
4.3.4.2.1.4 Business Drivers
4.3.4.2.2 Application
4.3.4.2.2.1 France Plant Genomics Market (by Application), Value Data
4.3.4.2.3 Product
4.3.4.2.3.1 France Plant Genomics Market (by Technology), Value Data
4.3.4.3 Italy
4.3.4.3.1 Markets
4.3.4.3.1.1 Buyer Attributes
4.3.4.3.1.2 Key Players in Italy
4.3.4.3.1.3 Business Challenges
4.3.4.3.1.4 Business Drivers
4.3.4.3.2 Application
4.3.4.3.2.1 Italy Plant Genomics Market (by Application), Value Data
4.3.4.3.3 Product
4.3.4.3.3.1 Italy Plant Genomics Market (by Technology), Value Data
4.3.4.4 Spain
4.3.4.4.1 Markets
4.3.4.4.1.1 Buyer Attributes
4.3.4.4.1.2 Key Players in Spain
4.3.4.4.1.3 Business Challenge
4.3.4.4.1.4 Business Driver
4.3.4.4.2 Application
4.3.4.4.2.1 Spain Plant Genomics Market (by Application), Value Data
4.3.4.4.3 Product
4.3.4.4.3.1 Spain Plant Genomics Market (by Product), Value Data
4.3.4.5 Netherlands
4.3.4.5.1 Markets
4.3.4.5.1.1 Buyer Attributes
4.3.4.5.1.2 Key Players in the Netherlands
4.3.4.5.1.3 Business Challenge
4.3.4.5.1.4 Business Drivers
4.3.4.5.2 Application
4.3.4.5.2.1 Netherlands Plant Genomics Market (by Application), Value Data
4.3.4.5.3 Product
4.3.4.5.3.1 Netherlands Plant Genomics Market (by Technology), Value Data
4.3.4.6 Rest-of-Europe
4.3.4.6.1 Markets
4.3.4.6.1.1 Buyer Attributes
4.3.4.6.1.2 Key Players in Rest-of-Europe
4.3.4.6.1.3 Business Challenges
4.3.4.6.1.4 Business Drivers
4.3.4.6.2 Application
4.3.4.6.2.1 Rest-of-Europe Plant Genomics Market (by Application), Value Data
4.3.4.6.3 Product
4.3.4.6.3.1 Rest-of-Europe Plant Genomics Market (by Technology), Value Data
4.4 U.K.
4.4.1 Markets
4.4.1.1 Buyer Attributes
4.4.1.2 Key Players in the U.K.
4.4.1.3 Business Challenges
4.4.1.4 Business Drivers
4.4.2 Application
4.4.2.1 U.K. Plant Genomics Market (by Application), Value Data
4.4.3 Product
4.4.3.1 U.K. Plant Genomics Market (by Technology), Value Data
4.5 Middle East and Africa
4.5.1 Markets
4.5.1.1 Key Players in the Middle East and Africa
4.5.1.2 Business Drivers
4.5.1.3 Business Challenges
4.5.2 Application
4.5.2.1 Middle East and Africa Plant Genomics Market (by Application), Value Data
4.5.3 Product
4.5.3.1 Middle East and Africa Plant Genomics Market (by Technology), Value Data
4.5.4 Middle East and Africa (by Country)
4.5.4.1 Israel
4.5.4.1.1 Markets
4.5.4.1.1.1 Buyer Attributes
4.5.4.1.1.2 Key Players in Israel
4.5.4.1.1.3 Business Challenges
4.5.4.1.1.4 Business Drivers
4.5.4.1.2 Application
4.5.4.1.2.1 Israel Plant Genomics Market (by Application), Value Data
4.5.4.1.3 Product
4.5.4.1.3.1 Israel Plant Genomics Market (by Technology), Value Data
4.5.4.2 South Africa
4.5.4.2.1 Markets
4.5.4.2.1.1 Buyer Attributes
4.5.4.2.1.2 Key Players in South Africa
4.5.4.2.1.3 Business Challenges
4.5.4.2.1.4 Business Drivers
4.5.4.2.2 Application
4.5.4.2.2.1 South Africa Plant Genomics Market (by Application), Value Data
4.5.4.2.3 Product
4.5.4.2.3.1 South Africa Plant Genomics Market (by Technology), Value Data
4.5.4.3 Saudi Arabia
4.5.4.3.1 Market
4.5.4.3.1.1 Buyer Attributes
4.5.4.3.1.2 Key Players in Saudi Arabia
4.5.4.3.1.3 Business Challenges
4.5.4.3.1.4 Business Drivers
4.5.4.3.2 Application
4.5.4.3.2.1 Saudi Arabia Plant Genomics Market (by Application), Value Data
4.5.4.3.3 Product
4.5.4.3.3.1 Saudi Arabia Plant Genomics Market (by Technology), Value Data
4.5.4.4 Rest-of-Middle East and Africa
4.5.4.4.1 Markets
4.5.4.4.1.1 Buyer Attributes
4.5.4.4.1.2 Key Players in Rest-of-Middle East and Africa
4.5.4.4.1.3 Business Challenges
4.5.4.4.1.4 Business Drivers
4.5.4.4.2 Application
4.5.4.4.2.1 Rest-of-Middle East and Africa Plant Genomics Market (by Application), Value Data
4.5.4.4.3 Product
4.5.4.4.3.1 Rest-of-Middle East and Africa Plant Genomics Market (by Technology), Value Data
4.6 China
4.6.1 Market
4.6.1.1 Buyer Attributes
4.6.1.2 Key Players in China
4.6.1.3 Business Challenges
4.6.1.4 Business Drivers
4.6.2 Application
4.6.2.1 China Plant Genomics Market (by Application), Value Data
4.6.3 Product
4.6.3.1 China Plant Genomics Market (by Technology), Value Data
4.7 Asia-Pacific and Japan
4.7.1 Markets
4.7.1.1 Key Players in Asia-Pacific and Japan
4.7.1.2 Business Drivers
4.7.1.3 Business Challenges
4.7.2 Application
4.7.2.1 Asia-Pacific and Japan Plant Genomics Market (by Application), Value Data
4.7.3 Product
4.7.3.1 Asia-Pacific and Japan Plant Genomics Market (by Technology)
4.7.4 Asia-Pacific and Japan (by Country)
4.7.4.1 Japan
4.7.4.1.1 Markets
4.7.4.1.1.1 Buyer Attributes
4.7.4.1.1.2 Key Players in Japan
4.7.4.1.1.3 Business Challenges
4.7.4.1.1.4 Business Drivers
4.7.4.1.2 Application
4.7.4.1.2.1 Japan Plant Genomics Market (by Application), Value Data
4.7.4.1.3 Product
4.7.4.1.3.1 Japan Plant Genomics Market (by Technology), Value Data
4.7.4.2 India
4.7.4.2.1 Markets
4.7.4.2.1.1 Buyer Attributes
4.7.4.2.1.2 Key Players in India
4.7.4.2.1.3 Business Challenges
4.7.4.2.1.4 Business Drivers
4.7.4.2.2 Application
4.7.4.2.2.1 India Plant Genomics Market (by Application), Value Data
4.7.4.2.3 Product
4.7.4.2.3.1 India Plant Genomics Market (by Technology), Value Data
4.7.4.3 Australia
4.7.4.3.1 Market
4.7.4.3.1.1 Buyer Attributes
4.7.4.3.1.2 Key Players in Australia
4.7.4.3.1.3 Business Challenges
4.7.4.3.1.4 Business Drivers
4.7.4.3.2 Application
4.7.4.3.2.1 Australia Plant Genomics Market (by Application), Value Data
4.7.4.3.3 Product
4.7.4.3.3.1 Australia Plant Genomics Market (by Technology), Value Data
4.7.4.4 South Korea
4.7.4.4.1 Market
4.7.4.4.1.1 Buyer Attributes
4.7.4.4.1.2 Key Players in South Korea
4.7.4.4.1.3 Business Challenges
4.7.4.4.1.4 Business Drivers
4.7.4.4.2 Application
4.7.4.4.2.1 South Korea Plant Genomics Market (by Application), Value Data
4.7.4.4.3 Product
4.7.4.4.3.1 South Korea Plant Genomics Market (by Technology), Value Data
4.7.4.5 Rest-of-Asia-Pacific and Japan
4.7.4.5.1 Markets
4.7.4.5.1.1 Buyer Attributes
4.7.4.5.1.2 Key Players in Rest-of-Asia Pacific and Japan
4.7.4.5.1.3 Business Challenges
4.7.4.5.1.4 Business Drivers
4.7.4.5.2 Application
4.7.4.5.2.1 Rest-of-Asia-Pacific and Japan Plant Genomics Market (by Application), Value Data
4.7.4.5.3 Product
4.7.4.5.3.1 Rest-of-Asia-Pacific and Japan Plant Genomics Market (by Technology), Value Data
5.1 Competitive Benchmarking
5.2 Company Profiles
5.2.1 Overview
5.2.2 BGI Genomics Co Ltd.
5.2.2.1 Company Overview
5.2.2.1.1 Role of BGI Genomics Co Ltd. in Global Plant Genomics Market
5.2.2.1.2 Product Portfolio
5.2.2.1.3 Production Sites and R&D Analysis
5.2.2.2 Corporate Strategies
5.2.2.2.1 Partnerships, Collaborations, and Joint Ventures
5.2.2.3 Strengths and Weaknesses of BGI Genomics Co Ltd.
5.2.3 Eurofins Scientific
5.2.3.1 Company Overview
5.2.3.1.1 Role of Eurofins Scientific in Global Plant Genomics Market
5.2.3.1.2 Product Portfolio
5.2.3.1.3 Production Site and R&D Analysis
5.2.3.2 Business Strategies
5.2.3.2.1 Product Developments
5.2.3.2.2 Market Developments
5.2.3.3 Corporate Strategies
5.2.3.3.1 Partnerships, Collaborations, and Joint Ventures
5.2.3.3.2 Mergers and Acquisitions
5.2.3.4 Strengths and Weaknesses of Eurofins Scientific
5.2.4 FLORAGENEX, INC.
5.2.4.1 Company Overview
5.2.4.1.1 Role of FLORAGENEX INC. in Global Plant Genomics Market
5.2.4.1.2 Product Portfolio
5.2.4.1.3 Production Sites and R&D Analysis
5.2.4.2 Strengths and Weaknesses of FLORAGENEX INC.
5.2.5 Front Range Biosciences
5.2.5.1 Company Overview
5.2.5.1.1 Role of Front Range Biosciences in Global Plant Genomics Market
5.2.5.1.2 Product Portfolio
5.2.5.1.3 Production Sites and R&D Analysis
5.2.5.2 Corporate Strategies
5.2.5.2.1 Partnerships, Collaborations, and Joint Ventures
5.2.5.3 Strengths and Weaknesses of Front Range Biosciences
5.2.6 Genewiz
5.2.6.1 Company Overview
5.2.6.1.1 Role of Genewiz in Global Plant Genomics Market
5.2.6.1.2 Product Portfolio
5.2.6.1.3 Production Sites and R&D Analysis
5.2.6.2 Business Strategies
5.2.6.2.1 Market Developments
5.2.6.3 Strengths and Weaknesses of Genewiz
5.2.7 Genotypic Technology Pvt. Ltd.
5.2.7.1 Company Overview
5.2.7.1.1 Role of Genotypic Technology Pvt. Ltd. in Global Plant Genomics Market
5.2.7.1.2 Product Portfolio
5.2.7.1.3 Production Sites and R&D Analysis
5.2.7.2 Strengths and Weaknesses of Genotypic Technology Pvt. Ltd.
5.2.8 Illumina, Inc.
5.2.8.1 Company Overview
5.2.8.1.1 Role of Illumina, Inc. in Global Plant Genomics Market
5.2.8.1.2 Product Portfolio
5.2.8.1.3 Production Site and R&D Analysis
5.2.8.2 Business Strategies
5.2.8.2.1 Market Developments
5.2.8.3 Strengths and Weaknesses of Illumina, Inc.
5.2.9 Keygene N.V.
5.2.9.1 Company Overview
5.2.9.1.1 Role of Keygene N.V. in Global Plant Genomics Market
5.2.9.1.2 Product Portfolio
5.2.9.1.3 Production Sites and R&D Analysis
5.2.9.2 Business Strategies
5.2.9.2.1 Product Developments
5.2.9.2.2 Market Development
5.2.9.3 Corporate Strategies
5.2.9.3.1 Partnerships, Collaborations, and Joint Ventures
5.2.9.4 Strengths and Weaknesses of Keygene N.V.
5.2.10 LC Sciences, LLC.
5.2.10.1 Company Overview
5.2.10.1.1 Role of LC Sciences, LLC. in Global Plant Genomics Market
5.2.10.1.2 Product Portfolio
5.2.10.1.3 Production Sites and R&D Analysis
5.2.10.2 Strengths and Weaknesses of LC Sciences, LLC.
5.2.11 Neogen Corporation
5.2.11.1 Company Overview
5.2.11.1.1 Role of Neogen Corporation in Global Plant Genomics Market
5.2.11.1.2 Product Portfolio
5.2.11.1.3 Production Sites and R&D Analysis
5.2.11.2 Strengths and Weaknesses of Neogen Corporation
5.2.12 Novogene Co., Ltd.
5.2.12.1 Company Overview
5.2.12.1.1 Role of Novogene Co., Ltd, in Global Plant Genomics Market
5.2.12.1.2 Product Portfolio
5.2.12.1.3 Production Sites and R&D Analysis
5.2.12.2 Business Strategies
5.2.12.2.1 Product Developments
5.2.12.2.2 Market Developments
5.2.12.3 Strengths and Weaknesses of Novogene Co., Ltd.
5.2.13 NRGene Ltd
5.2.13.1 Company Overview
5.2.13.1.1 Role of NRGene Ltd. in Global Plant Genomics Market
5.2.13.1.2 Product Portfolio
5.2.13.1.3 Production Site and R&D Analysis
5.2.13.2 Business Strategies
5.2.13.2.1 Product Developments
5.2.13.2.2 Market Developments
5.2.13.3 Corporate Strategies
5.2.13.3.1 Partnerships, Collaborations, and Joint Ventures
5.2.13.4 Strengths and Weaknesses of NRGene Ltd.
5.2.14 Oxford Nanopore Technologies
5.2.14.1 Company Overview
5.2.14.1.1 Role of Oxford Nanopore Technologies in Global Plant Genomics Market
5.2.14.1.2 Product Portfolio
5.2.14.1.3 Production Sites and R&D Analysis
5.2.14.2 Business Strategies
5.2.14.2.1 Market Developments
5.2.14.3 Corporate Strategies
5.2.14.3.1 Partnership and Collaboration
5.2.14.4 Strengths and Weaknesses of Oxford Nanopore Technologies
5.2.15 QIAGEN
5.2.15.1 Company Overview
5.2.15.1.1 Role of QIAGEN in Global Plant Genomics Market
5.2.15.1.2 Product Portfolio
5.2.15.1.3 Production Sites and R&D Analysis
5.2.15.2 Business Strategies
5.2.15.2.1 Product Developments
5.2.15.3 Corporate Strategies
5.2.15.3.1 Mergers and Acquisitions
5.2.15.4 Strengths and Weaknesses of QIAGEN
5.2.16 Traitgenetics GmbH
5.2.16.1 Company Overview
5.2.16.1.1 Role of Traitgenetics GmbH in Global Plant Genomics Market
5.2.16.1.2 Product Portfolio
5.2.16.1.3 Production Sites and R&D Analysis
5.2.16.2 Corporate Strategies
5.2.16.2.1 Mergers and Acquisitions
5.2.16.3 Strengths and Weaknesses of Traitgenetics GmbH
6.1 Data Sources
6.1.1 Primary Data Sources
6.1.2 Secondary Data Sources
6.2 Market Research Methodology
6.2.1 Data Triangulation
6.2.2 Market Estimation and Forecast
6.2.3 Assumptions
6.2.4 Limitations
7.1 Annexure A: List of Key Strategies and Developments in Global Plant Genomics Market (January 2017-September 2020)
7.2 Annexure B: List of Patents in Global Plant Genomics Market (January 2017-December 2019)
7.3 Annexure C: List of Investments and Funding in Global Plant Genomics Market (January 2017-September 2020)
Table 1: Key Consortiums and Associations in Global Plant Genomics Market
Table 2: Analyzing Threat of New Entrants
Table 3: Analyzing Bargaining Power of Buyers
Table 4: Analyzing Bargaining Power of Suppliers
Table 5: Analyzing the Threat from Substitute
Table 6: Analyzing the Intensity of Competitive Rivalry
Table 7: Impact Analysis of Business Drivers
Table 8: Impact Analysis of Business Challenges
Table 9: Initiatives of Governments of Various Countries to Promote Plant Genomics (January 1997-Septmeber 2020)
Table 10: Global Plant Genomics Market (by Application), $Million, 2019-2025
Table 11: Global Plant Genomics Market (by Farm Produce), $Million, 2019-2025
Table 12: Global Plant Genomics Market (by Product Offering), $ Million, 2019-2025
Table 13: Global Plant Genomics Market (by Technology), $ Million, 2019-2025
Table 14: Global Plant Genomics Market (by Region), $Million, 2019-2025
Table 15: North America Plant Genomics Technologies Market (by Application), $Million, 2019-2025
Table 16: North America Plant Genomics Market (by Technology), $Million, 2019-2025
Table 17: North America Plant Genomics Market (by Country), $Million, 2019-2025
Table 18: U.S. Plant Genomics Market (by Application), $Million, 2019-2025
Table 19: U.S. Plant Genomics Market (by Technology), $Million, 2019-2025
Table 20: Canada Plant Genomics Market (by Application), $Million, 2019-2025
Table 21: Canada Plant Genomics Market (by Technology), $Million, 2019-2025
Table 22: Mexico Plant Genomics Market (by Application), $Million, 2019-2025
Table 23: Mexico Plant Genomics Market (by Technology), $Million, 2019-2025
Table 24: South America Plant Genomics Market (by Application), $Million, 2019-2025
Table 25: South America Plant Genomics Market (by Technology), $Million, 2019-2025
Table 26: South America Plant Genomics Market (by Country), $Million, 2019-2025
Table 27: Brazil Plant Genomics Market (by Application), $Million, 2019-2025
Table 28: Brazil Plant Genomics Market (by Technology), $Million, 2019-2025
Table 29: Argentina Plant Genomics Market (by Application), $Million, 2019-2025
Table 30: Argentina Plant Genomics Market (by Technology), $Million, 2019-2025
Table 31: Chile Plant Genomics Market (by Application), $Million, 2019-2025
Table 32: Chile Plant Genomics Market (by Technology), $Million, 2019-2025
Table 33: Rest-of-South America Plant Genomics Market (by Application), $Million, 2019-2025
Table 34: Rest-of-South America Plant Genomics Market (by Technology), $Million, 2019-2025
Table 35: Europe Plant Genomics Market (by Application), $Million, 2019-2025
Table 36: Europe Plant Genomics Market (by Technology), $Million, 2019-2025
Table 37: Europe Plant Genomics Market (by Country), $Million, 2019-2025
Table 38: Germany Plant Genomics Market (by Application), $Million, 2019-2025
Table 39: Germany Plant Genomics Market (by Technology), $Million, 2019-2025
Table 40: France Plant Genomics Market (by Application), $Million, 2019-2025
Table 41: France Plant Genomics Market (by Technology), $Million, 2019-2025
Table 42: Italy Plant Genomics Market (by Application), $Million, 2019-2025
Table 43: Italy Plant Genomics Market (by Technology), $Million, 2019-2025
Table 44: Spain Plant Genomics Market (by Application), $Million, 2019-2025
Table 45: Spain Plant Genomics Market (by Technology), $Million, 2019-2025
Table 46: Netherlands Plant Genomics Market (by Application), $Million, 2019-2025
Table 47: Netherlands Plant Genomics Market (by Technology), $Million, 2019-2025
Table 48: Rest-of-Europe Plant Genomics Market (by Application), $Million, 2019-2025
Table 49: Rest-of-Europe Plant Genomics Market (by Technology), $Million, 2019-2025
Table 50: U.K. Plant Genomics Market (by Application), $Million, 2019-2025
Table 51: U.K. Plant Genomics Market (by Technology), $Million, 2019-2025
Table 52: Middle East and Africa Plant Genomics Market (by Application), $Million, 2019-2025
Table 53: Middle East and Africa Plant Genomics Market (by Technology), $Million, 2019-2025
Table 54: Middle East and Africa Plant Genomics Market (by Countries), $Million, 2019-2025
Table 55: Israel Plant Genomics Market (by Application), $Million, 2019-2025
Table 56: Israel Plant Genomics Market (by Technology), $Million, 2019-2025
Table 57: South Africa Plant Genomics Market (by Application), $Million, 2019-2025
Table 58: South Africa Plant Genomics Market (by Technology), $Million, 2019-2025
Table 59: Saudi Arabia Plant Genomics Market (by Application), $Million, 2019-2025
Table 60: Saudi Arabia Plant Genomics Market (by Technology), $Million, 2019-2025
Table 61: Rest-of-Middle East and Africa Plant Genomics Market (by Application), $Million, 2019-2025
Table 62: Rest-of-Middle East and Africa Plant Genomics Market (by Technology), $Million, 2019-2025
Table 63: China Plant Genomics Market (by Application), $Million, 2019-2025
Table 64: China Plant Genomics Market (by Technology), $Million, 2019-2025
Table 65: Asia-Pacific and Japan Plant Genomics Market (by Application), $Million, 2019-2025
Table 66: Asia-Pacific and Japan Plant Genomics Market (by Technology), $Million, 2019-2025
Table 67: Asia-Pacific and Japan Plant Genomics Market (by Country), $Million, 2019-2025
Table 68: Japan Plant Genomics Market (by Application), $Million, 2019-2025
Table 69: Japan Plant Genomics Market (by Technology), $Million, 2019-2025
Table 70: India Plant Genomics Market (by Application), $Million, 2019-2025
Table 71: India Plant Genomics Market (by Technology), $Million, 2019-2025
Table 72: Australia Plant Genomics Market (by Application), $Million, 2019-2025
Table 73: Australia Plant Genomics Market (by Technology), $Million, 2019-2025
Table 74: South Korea Plant Genomics Market (by Application), $Million, 2019-2025
Table 75: South Korea Plant Genomics Market (by Technology), $Million, 2019-2025
Table 76: Rest-of-Asia-Pacific and Japan Plant Genomics Market (by Application), $Million, 2019-2025
Table 77: Rest-of-Asia-Pacific and Japan Plant Genomics Market (by Technology), $Million, 2019-2025
Table 78: BGI Genomics Co Ltd.: Product Portfolio
Table 79: Partnerships, Collaborations, and Joint Ventures
Table 80: Eurofins Scientific: Product Portfolio
Table 81: Product Developments
Table 82: Market Developments
Table 83: Partnerships, Collaborations, and Joint Ventures
Table 84: Mergers and Acquisitions
Table 85: FLORAGENEX INC: Product Portfolio
Table 86: Front Range Biosciences: Product Portfolio
Table 87: Partnerships, Collaborations, and Joint Ventures
Table 88: Genewiz: Product Portfolio
Table 89: Market Developments
Table 90: Genotypic Technology Pvt. Ltd.: Product Portfolio
Table 91: Illumina, Inc.: Product Portfolio
Table 92: Market Developments
Table 93: Keygene N.V.: Product Portfolio
Table 94: Product Developments
Table 95: Market Development
Table 96: LC Science, LLC.: Product Portfolio
Table 97: Neogen Corporation: Product Portfolio
Table 98: Novogene Co. Ltd,: Product Portfolio
Table 99: Product Developments
Table 100: Market Developments
Table 101: NRGene Ltd.: Product Portfolio
Table 102: Product Developments
Table 103: Market Developments
Table 104: Oxford Nanopore Technologies: Product Portfolio
Table 105: Market Developments
Table 106: QIAGEN: Product Portfolio
Table 107: Product Developments
Table 108: Mergers and Acquisitions
Table 109: Traitgenetics GmbH: Product Portfolio
Figure 1: Macroeconomic Trends Impacting Global Plant Genomics Market
Figure 2: Drivers and Challenges: Global Plant Genomics Market
Figure 3: Global Plant Genomics Market, $Million, 2019-2025
Figure 4: Snapshot of Global Plant Genomics Market (by Technology), $Million, 2019-2025
Figure 5: Snapshot of Global Plant Genomics Market (by Product), $Million, 2019-2025
Figure 6: Snapshot of Global Plant Genomics Market (by Application), $Million, 2019-2025
Figure 7: Snapshot of Global Plant Genomics Market (by Farm Produce), $Million, 2019-2025
Figure 8: Snapshot of Global Plant Genomics Market (by Region), $Million, 2020
Figure 9: Global Plant Genomics Market: Coverage
Figure 10: Classification and Analysis of Government Programs and Initiatives Landscape
Figure 11: Government Initiative Landscape in North America
Figure 12: Government Initiative Landscape in Europe
Figure 13: Government Initiative Landscape in Asia-Pacific and Japan
Figure 14: Government Initiative Landscape in Rest-of-the-World
Figure 15: Regulatory Framework for GM Crops in India
Figure 16: Global Plant Genomics Market: Investment and Funding, $Million, January 2017-September 2020
Figure 17: Investment and Funding landscape Share (by Round), $Million
Figure 18: Investment and Funding landscape Share (by Application), $Million
Figure 19: Year-Wise Patents Filed or Granted for Plant Genomics Market, January 2017-December 2019
Figure 20: Patent Analysis, (by Status), January 2017-December 2019
Figure 21: Patent Analysis (by Applicant Profile), January 2017-December 2019
Figure 22: Patent Analysis (by Company), January 2017-December 2019
Figure 23: Patent Analysis (by Technology), January 2017- December 2019
Figure 24: Patent Analysis, (by Patent Office), January 2017-December 2019
Figure 25: Porter’s Five Forces Analysis
Figure 26: Global Plant Genomics Market, Business Dynamics
Figure 27: Global Food Demand Projection, 2017-2050
Figure 28: Global Crop Losses Issues
Figure 29: Cost of DNA Sequencing
Figure 30: Key Business Strategies
Figure 31: Key Product Developments (by Company)
Figure 32: Key Market Developments (by Company)
Figure 33: Key Corporate Strategies
Figure 34: Key Partnerships, Collaborations and Joint Ventures (by Company)
Figure 35: Global Plant Genomics Market (by Application)
Figure 36: Advantages of Herbicide Tolerant Crops
Figure 37: Global Plant Genomics Market (for Yield Improvement), $Million, 2019-2025
Figure 38: Global Plant Genomics Market (for Disease Resistance), $Million, 2019-2025
Figure 39: Global Plant Genomics Market (Herbicide Tolerance), $Million, 2019-2025
Figure 40: Global Plant Genomics Market (Other Applications), $Million, 2019-2025
Figure 41: Plant Genomics by Farm Produce
Figure 42: Cereals in Global Plant Genomics Market (by Farm Produce), $Million, 2019-2025
Figure 43: Oil Crops in Global Plant Genomics Market (by Farm Produce), $Million, 2019-2025
Figure 44: Fiber Crops in Global Plant Genomics Market (by Farm Produce), $Million, 2019-2025
Figure 45: Pulses in Global Plant Genomics Market (by Farm Produce), $Million, 2019-2025
Figure 46: Fruits in Global Plant Genomics Market (by Farm Produce), $Million, 2019-2025
Figure 47: Roots and Tubers in Global Plant Genomics Market (by Farm Produce), $Million, 2019-2025
Figure 48: Vegetables in Global Plant Genomics Market (by Farm Produce), $Million, 2019-2025
Figure 49: Tree Nuts in Global Plant Genomics Market (by Farm Produce), $Million, 2019-2025
Figure 50: Global Plant Genomics Market (by Product Offering)
Figure 51: Plant Genomics Market for Support Services
Figure 52: Global Plant Genomics Market (Hardware Devices), $Million, 2019-2025
Figure 53: Global Plant Genomics Market (Software/Platform), $Million, 2019-2025
Figure 54: Global Plant Genomics Market (Support Services), $Million, 2019-2025
Figure 55: Global Plant Genomics Market (by Technology)
Figure 56: Key Benefits of DNA/RNA Sequencing Technology
Figure 57: Comparison of Sequencing Technologies
Figure 58: Advantages of Marker-Assisted Selection (MAS)
Figure 59: Global Plant Genomics Market (DNA/RNA Sequencing), $Million, 2019- 2025
Figure 60: Global Plant Genomics Market (Genotyping), $Million, 2019- 2025
Figure 61: Global Plant Genomics Market (Marker-Assisted Selection), $Million, 2019- 2025
Figure 62: Global Plant Genomics Market (Bioinformatics), $Million, 2019- 2025
Figure 63: Global Plant Genomics Market (Others), $Million, 2019- 2025
Figure 64: Competitive Benchmarking Matrix
Figure 65: Segmentation of Key Companies Profiled by Type of Headquarter Country
Figure 66: Primary Interviews Breakdown, by Company, Designation, and Region
Figure 67: Sources of Secondary Research
Figure 68: Report Methodology
Figure 69: Data Triangulation
Figure 70: Top-Down and Bottom-Up Approach for Market Estimation
|
Market Report Coverage - Plant Genomics |
|||
|
Base Year |
2019 |
Market Size in 2019 |
$7.26 Billion |
|
Forecast Period |
2020-2025 |
Value Projection and Estimation by 2025 |
$12.26 Billion |
|
CAGR During Forecast Period |
11.06% |
Number of Tables |
109 |
|
Number of Pages |
241 |
Number of Figures |
70 |
|
Research Hours |
1020 |
|
|
|
Market Segmentation |
• Applications- Yield Improvement, Disease Resistance, Herbicide Tolerance, and Others • Technology- DNA/RNA Sequencing, Bioinformatics, Genotyping, Marker-Assisted Selection and Others • Product Offering- Hardware Device, Software/Platform, and Support Services • Farm Produce- Cereals, Fiber crops, Oil crops, Pulses, Vegetables, Fruits, Roots and Tubers, and Tree Nuts • Region – North America, South America, Europe, U.K., China, Asia-Pacific Japan, and Middle East and Africa |
||
|
Regional Segmentation |
• North America – U.S., Canada, and Mexico • South America – Brazil, Argentina, Chile, and Rest-of-South America • Europe –Germany, France, Italy, Spain, Netherlands, and Rest-of-Europe • U.K. • China • Asia-Pacific and Japan – Japan, India, Australia, South Korea and Rest-of-Asia-Pacific and Japan • Middle East and Africa –Israel, South Africa, Saudi Arabia and Rest-of-Middle East and Africa |
||
|
Business Drivers |
• Rising Need for Improved Crop Traits • Increasing Need to Reduce Crop Losses • Reducing Cost of DNA Sequencing and Synthesizing |
||
|
Business Challenges |
• High Initial Deployment Cost • Lack of Awareness in Handling Modern Plant Genomics Technologies in Developing Countries |
||
|
Business Opportunities |
• Favorable Government Initiatives to Support Research and Development • Increasing Opportunity for Using Next-Generation Sequencing Technologies |
||
|
Key Plant Genomics Companies Profiled |
Eurofins Scientific, Illumina, Inc., Front Range Biosciences, Qiagen, NRGene, Neogen Corporation, Keygene N.V., LC Sciences, LLC., Traitgenetics GmbH, Novogene Co., Ltd., Oxford Nanopore Technologies, Genewiz, BGI Genomics Co. Ltd., Floragenex, Inc., Genotypic Technology Pvt. Ltd. |
||
• What is the expected global plant genomics market size in terms of value during 2019-2025?
• What is the expected future scenario and revenue generated by the application segments including yield management, herbicide tolerance, and disease resistance?
• What is the expected future scenario and revenue to be generated by the different types of product offerings, including hardware, software/platform, and support services, during the forecast period 2020-2025?
• What is the expected future scenario and revenue to be generated by the different types of technologies, including DNA/RNA sequencing, genotyping, marker-assisted selection, and bioinformatics during the forecast period 2020-2025?
• What is the expected future scenario and revenue to be generated by the plant genomics for different farm produce, including cereals, oil crops, fiber, fruits, and vegetables, among others?
• What are the different regulations present in different regions regarding the development of crops through plant genomics?
• Which region is the largest market for the global plant genomics market?
• What is the expected future scenario and the revenue to be generated by different regions and countries in the plant genomics market?
• What is the competitive strength of the key players in the plant genomics market on the basis of the analysis of their recent developments, product offerings, and regional presence?
• Where do the key plant genomics companies lie in their competitive benchmarking, compared to the factors of market coverage and market potential?
• How is the government initiative landscape across different regions and countries in the plant genomics market?
• How is the funding and investment landscape in the global plant genomics market?
• Which are the leading consortiums and associations in the global plant genomics market, and what is their role in the market?
• What are the market dynamics of the global plant genomics market, including market drivers, restraints, and opportunities?
• How has COVID-19 impacted the global plant genomics market?
Market Size, Forecast, and Analysis
Figure: Global Plant Genomics Market Snapshot
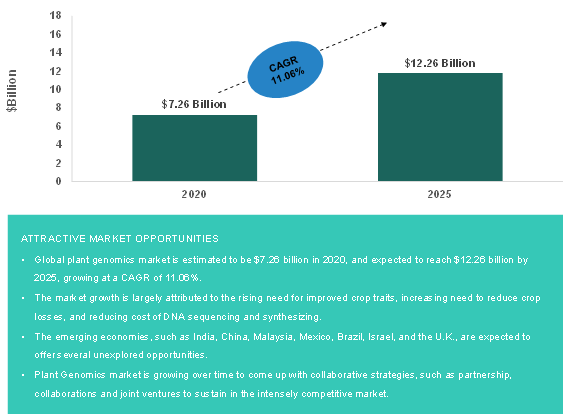
Source: Expert Interviews and BIS Research Analysis
The global plant genomics market is projected to grow from $7.26 billion in 2020 to $12.26 billion by 2025, at a CAGR 11.06% from 2020 to 2025. The growth in plant genomics market is expected to be driven by rising need for improved crop traits, increasing need to reduce crop losses, and reducing cost of DNA sequencing and synthesizing.
Plant genomics caters to several applications such as yield management, diseases resistance, and herbicide tolerance. The utilization of technologies in plant genomics, such as DNA/RNA sequencing, genotyping, marker-assisted selection and bioinformatics, is expected to augment the growth of plant genomics in the technology sector. Moreover, depleting agricultural land and increasing demand for fresh agricultural produce all around the year are expected to propagate the growth of plant genomics market.
Competitive Landscape
The competitive landscape of the plant genomics market consists of different strategies undertaken by major players across the industry to gain market presence. The competitive landscape for the plant genomics market demonstrates an inclination toward companies adopting strategies, such as product launch and development and partnerships, collaborations, and joint ventures. The major established players in the market focus on partnerships, collaborations, and joint ventures to introduce new technologies or develop further on the existing product portfolio. KeyGene, N.V., Novogene, Oxford Nanopore Technologies, Genewiz, Front Range Biosciences, and Eurofins Scientific are some of the prominent players in the plant genomics market. The market is highly fragmented with the presence of a large number of small- to medium-sized companies that compete with each other and the large enterprises.
Regional Market Dynamics
The global plant genomics market holds a prominent share in various countries of North America and Europe. North America is at the forefront of the global plant genomics market, with a high market penetration rate in the U.S., and Canada, which are expected to display robust market growth in the coming five years.
During the forecast period 2020-2025, the Asia-Pacific and Japan region is expected to flourish as one of the most lucrative markets for plant genomics. Asia-Pacific and Japan region is expected to exhibit significant growth opportunities for plant genomics due to the increased optimism in the economic conditions of these countries. The countries in this region present immense scope for market development, owing to the increasing urban population size, growing market penetration of advanced technologies, favorable government investments on the adaptation of innovative farming technologies.
Focus on Product Offering, Technology, Application, Farm Produce, Patent, Government Programs and Funding - Analysis and Forecast, 2020-2025
The global plant-based food and beverage alternatives market to grow at a significant CAGR of...
The NGS in agrigenomics market is expected to reach $1,389.0 million at a CAGR of 12.5% from...
1. Please contact us to discuss customization options, and we can confirm the time and cost (if any). For minor customization requirements that would take 3-5 days, we do not charge any additional amount.
2. All BIS Research reports are delivered to clients via our InsightMonk platform. This allows the customers to extract the data in Excel for their use. Excel is provided for all License types and is not limited to just enterprise users.
3. Additionally, all customers also get access to the following complimentary value-added services from BIS Research.
*Expert Consultation Charges applicable