
Published Year: 2024
Global Collaborative Robot (Cobot) Market: Focus on Industry, Application, Type, Payload, Component,
The global collaborative robot (cobot) market is projected to reach $6,972.6 million by 2033...
Focus on Solution (Hardware and Software) and End Users - Analysis and Forecast, 2020-2025
Delivery Time: 1-5 Working Days
Get ISO Certified Research, Customization, Data Extraction, and Value-Added Services with All BIS Research Reports
BIS Research provides a comprehensive report library with unlimited access to data, insights, and market intelligence through Subscription.
Get Subscription Know More|
Smart Factory and Manufacturing Market |
|||
|
Base Year |
2019 |
Market Size by 2019 |
$64.64 Billion |
|
Forecast Period |
2020-2025 |
Value Estimation by 2030 |
$105.12 Billion |
|
CAGR During Forecast Period |
8.71% |
|
|
|
Market Segmentation |
• Solution – Hardware and Software • End-User – Food & Beverages, Pharmaceuticals, Automotive, FMCG, Oil & Gas, Metal & Machining, and others |
||
|
Regional Segmentation |
North America – Canada and U.S. Europe - U.K., Germany, France, Spain, Italy, and Rest-of-Europe Asia-Pacific – China, India, South Korea, Japan, and Rest-of-Asia-Pacific Rest-of-the-World – Middle East, Africa and Latin America |
||
|
Key Companies Profiled |
The key market players in the global Smart Factory and Manufacturing market include ABB Ltd, Honeywell International Inc., Schneider Electric, Siemens AG, Rockwell Automation Inc, Emerson Electric CO., OMRON Corporation, Dassault Systèmes, IBM Corporation, Bosch Rexroth AG, Fanuc Corporation, General Electric, Kuka AG, OMRON Corporation, Mitsubishi Electric Corporation, and Stratasys Ltd. |
||
Market Segmentation
Based on the type of solution, the hardware solution segment is expected to gather the largest market share during the forecast period. Due to the wide array of adoption of hardware segments for industrial robots and IIoT sensors and the high cost of devices associated with them, this market segment gathered a share of 57% of the overall market in 2019. Major companies such as ABB Ltd., Honey Well, Schneider Electric, Siemens AG, Rockwell Automation, and Emerson Electric CO are efficiently developing smart factory and manufacturing hardware solutions widely utilized in different manufacturing industries.
Market Segmentation by End-User
Industrial automation software has many potential applications across several domains, namely, automotive, oil & gas, pharmaceuticals, metal and machining, food & beverages, and FMCG. In 2019, the automotive segment held the largest market share, with 25% of the overall market size. However, the pharmaceutical industry is estimated to register the highest growth rate during the forecast period 2020-2025, due to the increasing adoption of smart factory solutions by new startups and SMEs in the industry, that would result in increased production capacity for medical supplies.
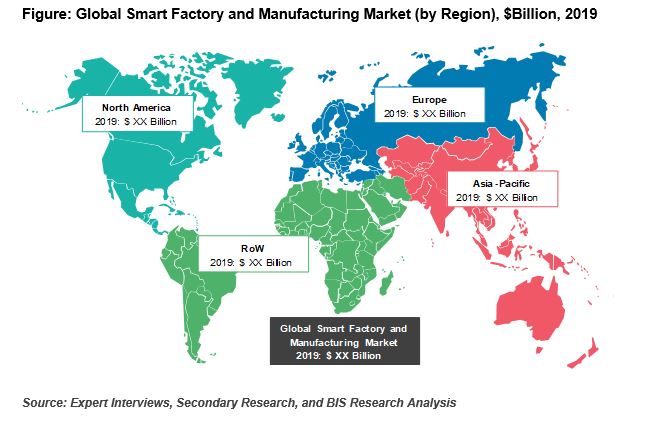
Market Segmentation by Region
In 2019, the Asia-Pacific region held the highest market share in the overall smart factory and manufacturing market, followed by Europe and North America. This market growth is mainly due to the increasing adoption of automation solutions in APAC countries such as China, Japan, and South Korea. During the forecast period 2020-2025, the Asia-Pacific region is expected to witness the highest growth rate of 9.26% and generate $65.65 billion by 2025.
With the ongoing fourth industrial revolution, the need for automation and digital industrial technologies in manufacturing processes has escalated drastically. More connected machines and automated solutions are required both in hardware and software sides that laid the foundation of the smart factory and manufacturing industry.
Presently, the smart factory and manufacturing market are witnessing a high growth rate owing to the rising trends of new digital industrial technologies and the growing need for improved productivity, speed, and efficiency. Furthermore, recent innovations and government funding in industrial IoT and connected environment have enabled the solution providers to reach a wider segment of consumers in the industry.
However, the reluctance to adopt this emerging technology solution by SMEs due to high initial deployment cost and integration with traditional current systems contributes to major challenges for market growth. Additionally, increasing competition among the companies in the near future as well as increase the utilization of automation solutions for varied end-users such as automotive, oil & gas, food & beverages, fast-moving consumer goods (FMCG), pharmaceuticals, and others.
A significant number of new players have emerged in the market that provides advanced cloud robotics platforms for different industries and applications. Several leading companies, such as ABB Ltd., Siemens AG, Emerson Electric, and Honeywell, have adopted inorganic growth strategies such as mergers and acquisitions to strengthen their product portfolios. With the ongoing efforts of industry players to develop high-end solutions for different end-users, the global smart factory and manufacturing market are anticipated to grow at an exponential rate in the next five years (2020-2025).
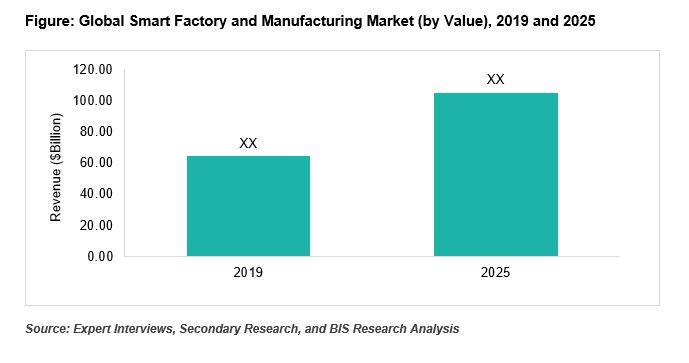
According to the market study by BIS Research, the global smart factory and manufacturing market generated overall revenue of $64.64 billion in 2019 and is projected to reach the mark of $105.12 billion by 2025. During the forecast period 2020-2025, the market shows a remarkable CAGR of 8.71%, while providing ample opportunities for market players and new entrants.
|
Growth Drivers |
• Rising Trend of New Digital Industrial Technologies Such as Industry 4.0 and Industrial IoT • Growing Need for Improved Productivity, Speed, and Efficiency |
||
|
Market Challenges |
• Reluctance in Adoption of Smart Factory Solutions by SMEs due to High Initial Deployment Cost and Integration With Legacy Current System |
||
|
Market Opportunities |
• Rollout of 5G Services • Growth Opportunity in Smart Analytics Market |
||
Growth Factors
Rising Trend of New Digital Industrial Technologies Such as Industry 4.0 and Industrial IoT
The ongoing popularity of the Industry 4.0 or the fourth industrial revolution, has driven the demand for smart factory and manufacturing market for improved efficiency. Several government initiatives have been launched to provide a connected environment to a wide array of consumers in the industry. For instance, ‘Make in India,’ a government of India initiative aims at increasing the proliferation of the manufacturing industry in the country to boost the economy.
Growing Need for Improved Productivity, Speed, and Efficiency
As several industries such as FMCG, automotive, pharmaceuticals, and oil & gas, the increasing need for utilization of automation solution has plummeted in recent years. High deployment of digital industrial technologies such as industrial IoT has driven the growth in need for improved speed, efficiency, and productivity.
Focus on Solution (Hardware and Software) and End Users - Analysis and Forecast, 2020-2025
The global collaborative robot (cobot) market is projected to reach $6,972.6 million by 2033...

The global industrial automation software industry analysis conducted by BIS Research...