Published Year: 2021
Precision Agriculture Market - A Global and Regional Analysis: Focus on Applications, Products and C
The global precision agriculture market is expected to reach $10.93 billion by 2026, with a...
Focus on Product and Application, Supply Chain Analysis, and Country Analysis - Analysis and Forecast, 2022-2027
Delivery Time: 1-5 Working Days
Get ISO Certified Research, Customization, Data Extraction, and Value-Added Services with All BIS Research Reports
BIS Research provides a comprehensive report library with unlimited access to data, insights, and market intelligence through Subscription.
Get Subscription Know MoreGlobal Smart Irrigation Controllers Market: Industry Overview
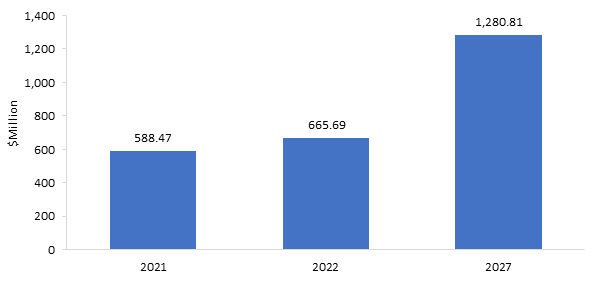
The global smart irrigation controllers market was valued at $588.47 million in 2021, which is expected to grow with a CAGR of 13.98% and reach $1,280.81 million by 2027. The growth in the global smart irrigation controllers market is expected to be driven by the increasing adoption of smart agriculture practices and government initiatives toward sustainable irrigation techniques.
Market Lifecycle Stage
The smart irrigation controllers market is in the introductory growth phase. Increased research and development activities in agriculture, rising awareness of tech-based farming, climatic change, and water scarcity in many countries are expected to increase the demand for smart irrigation controllers among the farmers and agriculture companies.
Data management of farms with the help of big data and advancements in communication technologies are some of the major opportunities in the global smart irrigation controllers market. Moreover, the smart irrigation controllers market has huge opportunities in the Asia-Pacific region since most of the countries located in this region have huge agricultural sectors that contribute to each of the nations’ GDP.
Impact
• North America generated the highest revenue of $211.85 million in 2021, which is expected to reach $440.40 million by 2027. The region has been experiencing rapid growth in the smart irrigation industry in the past few years owing to the increasing technological advancements and increasing government support for the use of smart irrigation controllers. Most of the water used for landscape irrigation is wasted because of the use of traditional irrigation systems. Increasing demand for smart irrigation controllers that meet the demand for run times and water schedules automatically is expected to increase the growth in the coming years.
• Furthermore, Europe generated a revenue of $117.69 million in 2021 and is expected to grow at a CAGR of 12.95% from 2022 to 2027. High revenue generation was majorly attributed to increasing the use of smart irrigation systems and increasing investments from the European Commission for IoT-based smart irrigation. Most of the growth is expected to be driven by Eastern Europe countries in the forecast period.
Impact of COVID-19
The COVID-19 impact on the smart irrigation market was witnessed in the short term in 2020 and in 2021. However, the market is anticipated to witness robust growth and recovery with increasing demand for installation of the IoT devices in the agricultural farms throughout the world to make optimum utilization of resources with limited labor requirements in the agriculture fields. Therefore, the demand for smart irrigation controllers in agri and non-agri sectors is expected to increase during and post-COVID-19 pandemic.
Market Segmentation:
Segmentation 1: by Application
• Agriculture
• Non-Agriculture
The global smart irrigation controllers market, based on the application segment, is expected to be dominated by the non-agriculture industry. This is due to the increasing usage of smart irrigation controllers in golf courses, sports grounds, residential areas, private lawns, and gardens.
Segmentation 2: by Type
• Soil-Based Controller
• Weather-Based Controller
The smart irrigation controllers market (by type) is dominated by weather-based irrigation controllers followed by soil-based irrigation controllers. Soil-based irrigation controllers are expected to witness the highest CAGR of 15.18% during the forecast period because sensors installed help in getting real-time soil moisture data at a faster rate depending upon the irrigation requirements. Soil-based controllers are better than weather-based controllers because they do not depend on weather forecasts or the data from the weather stations.
Segmentation 3: by Region
• North America - U.S., Canada, and Mexico
• Europe - Germany, Netherlands, Spain, France, and Rest-of-Europe
• China
• U.K.
• Asia-Pacific - Japan, India, Australia and New Zealand, and Rest-of-Asia-Pacific
• South America - Brazil, Argentina, and Rest-of-South America
• Middle East and Africa - South Africa, Israel, and Rest-of-Middle East and Africa
The Asia-Pacific region is the fastest-growing market in the smart irrigation controllers industry. The rapid change in the climatic conditions, increasing government support, and increasing the need for saving water are the factors supporting the growth of smart irrigation controllers in the region.
Recent Developments in Global Smart Irrigation Controllers Market
• In February 2022, Calsense launched Irrigation Management in terms of a Service, or IMaaS. IMaaS basically represents a unique also highly valuable approach to irrigation management, where it eliminates the need for customers mainly to secure capital funds to buy smart irrigation controllers, sensors as well as software.
• In May 2021, the Toro Company acquired Left Hand Robotics, Inc. The acquisition mainly supports the Toro Company’s strategic leadership in next-generation technologies, which include alternative power, smart connected, as well as autonomous products.
• In March 2020, Netafim had a collaboration with FluroSat to integrate FluroSat’s remote sensing technology into Netafim’s digital irrigation management platform Netbeat.
• In June 2019, Rain Bird partnered with Living Turf as a primary distributor for the full range of Rain Bird Gold Irrigation products throughout Australia. This partnership would enable Rain Bird to expand in Australia.
Demand - Drivers and Limitations
Following are the demand drivers for the smart irrigation controllers market:
• Increasing Adoption of Smart Agriculture Practice
• Increasing Need for Water Conservation
• Increased Government Initiative to Promote Sustainable Irrigation Technique
The market is expected to face some limitations too due to the following challenges:
• High Cost of Smart Irrigation Systems
• Lack of Standardization
• Lack of Technical Knowledge and Limited Awareness among Farmers
Analyst Thoughts
According to Aparajita Borah, Senior Research Associate, BIS Research, “The smart irrigation controllers market is expected to be a great replacement of conventional irrigation controllers. Through a better adoption of these smart irrigation controllers, agriculture can be taken to an advanced level. Issues such as climate change and water scarcity can also be addressed, which will offer proper food security."
Focus on Product and Application, Supply Chain Analysis, and Country Analysis - Analysis and Forecast, 2022-2027
Smart irrigation controllers manage watering schedules and run times automatically to meet some specific landscape needs. These controllers are also proven technology to enhance outdoor water use efficiencies. A smart irrigation system mainly collects information from sensors and then sends predefined user orders to actuators, which further make the water sprinkler go off. The data has been collected further by moisture sensors. Smart irrigation controllers also save water use.
The key trends in the smart irrigation controllers market include advancements in communication technologies and farm data management with big data. Smartphones have been receiving high traction for the past several years. Hence, most of the smart home-based irrigation controller manufacturers are focusing on integrating functionalities that can allow communication through smart home systems through voice.
The global smart irrigation controllers market has seen major development by key players operating in the market, such as product launch, business expansion, partnership, collaboration, and joint ventures. According to BIS Research analysis, the majority of the companies preferred partnerships, collaborations, and joint ventures as a strategy to further increase their growth in the global smart irrigation controller market. Companies such as Toro Company, Netafim, and Calsense have majorly adopted partnerships, collaborations, and joint venture strategies.
A new entrant can focus on the latest technology to implement with smart irrigation controllers and tap untapped markets. They can also focus on entering in APAC market.
The following are the USPs of this report:
• Extensive competitive benchmarking of the top 15 players, including companies offering smart irrigation controllers for both agri and non-agri applications, has been done to offer a holistic view of the global smart irrigation controllers market landscape.
• Market ranking analysis based on product portfolio, recent developments, and regional spread
• Investment landscape including product adoption scenario, funding, and patent analysis
The companies that manufacture and commercialize smart irrigation controllers, companies that produce machinery for agricultural uses, agri-input suppliers, raw material suppliers, research institutions, and regulatory bodies can buy this report.
The global precision agriculture market is expected to reach $10.93 billion by 2026, with a...