A quick peek into the report
Table of Contents
1.1 Trends: Current and Future Impact Assessment
1.2 Market Dynamics Overview
1.2.1 Market Drivers
1.2.2 Market Restraints
1.2.3 Market Opportunities
1.3 Regulatory & Policy Impact Analysis
1.3.1 By Region
1.4 Patent Analysis
1.4.1 By Year
1.4.2 By Region
1.5 Technology Landscape
1.6 Key Benefits of using CT Scanning in Vehicles
1.7 Start-Up Landscape
1.8 Investment Landscape and R&D Trends
1.9 Value Chain Analysis
1.10 Industry Attractiveness
2.1 Industrial CT Scanners
2.2 Mobile CT Scanners
2.3 Automated CT Scanners
2.4 CT with AI Analysis
3.1 Quality Control
3.2 Prototype Development
3.3 Material Analysis
3.4 Non-Destructive Testing
3.5 Structural Integrity
4.1 Original Equipment Manufacturers
4.2 Automotive Aftermarket and Maintenance Service Providers
4.3 Research and Development Institutions
4.4 Tier 1 and Tier 2 Automotive Suppliers
5.1 Global Vehicle Computer Tomography Market (by Region)
5.2 North America
5.2.1 Regional Overview
5.2.2 Driving Factors for Market Growth
5.2.3 Factors Challenging the Market
5.2.4 Key Companies
5.2.5 Scanner Type
5.2.6 Application
5.2.7 End User
5.2.8 North America (by Country)
5.2.8.1 U.S.
5.2.8.1.1 Market by Scanner Type
5.2.8.1.2 Market by Application
5.2.8.1.3 Market by End User
5.2.8.2 Canada
5.2.8.2.1 Market by Scanner Type
5.2.8.2.2 Market by Application
5.2.8.2.3 Market by End User
5.2.8.3 Mexico
5.2.8.3.1 Market by Scanner Type
5.2.8.3.2 Market by Application
5.2.8.3.3 Market by End User
5.3 Europe
5.3.1 Regional Overview
5.3.2 Driving Factors for Market Growth
5.3.3 Factors Challenging the Market
5.3.4 Key Companies
5.3.5 Scanner Type
5.3.6 Application
5.3.7 End User
5.3.8 Europe (by Country)
5.3.8.1 Germany
5.3.8.1.1 Market by Scanner Type
5.3.8.1.2 Market by Application
5.3.8.1.3 Market by End User
5.3.8.2 France
5.3.8.2.1 Market by Scanner Type
5.3.8.2.2 Market by Application
5.3.8.2.3 Market by End User
5.3.8.3 Italy
5.3.8.3.1 Market by Scanner Type
5.3.8.3.2 Market by Application
5.3.8.3.3 Market by End User
5.3.8.4 Spain
5.3.8.4.1 Market by Scanner Type
5.3.8.4.2 Market by Application
5.3.8.4.3 Market by End User
5.3.8.5 U.K.
5.3.8.5.1 Market by Scanner Type
5.3.8.5.2 Market by Application
5.3.8.5.3 Market by End User
5.3.8.6 Rest-of-Europe
5.3.8.6.1 Market by Scanner Type
5.3.8.6.2 Market by Application
5.3.8.6.3 Market by End User
5.4 Asia-Pacific
5.4.1 Regional Overview
5.4.2 Driving Factors for Market Growth
5.4.3 Factors Challenging the Market
5.4.4 Key Companies
5.4.5 Scanner Type
5.4.6 Application
5.4.7 End User
5.4.8 Asia-Pacific (by Country)
5.4.8.1 China
5.4.8.1.1 Market by Scanner Type
5.4.8.1.2 Market by Application
5.4.8.1.3 Market by End User
5.4.8.2 Japan
5.4.8.2.1 Market by Scanner Type
5.4.8.2.2 Market by Application
5.4.8.2.3 Market by End User
5.4.8.3 India
5.4.8.3.1 Market by Scanner Type
5.4.8.3.2 Market by Application
5.4.8.3.3 Market by End User
5.4.8.4 South Korea
5.4.8.4.1 Market by Scanner Type
5.4.8.4.2 Market by Application
5.4.8.4.3 Market by End User
5.4.8.5 Rest-of-Asia-Pacific
5.4.8.5.1 Market by Scanner Type
5.4.8.5.2 Market by Application
5.4.8.5.3 Market by End User
5.5 Rest-of-the-World
5.5.1 Regional Overview
5.5.2 Driving Factors for Market Growth
5.5.3 Factors Challenging the Market
5.5.4 Key Companies
5.5.5 Scanner Type
5.5.6 Application
5.5.7 End User
5.5.8 Rest-of-the-World (by Region)
5.5.8.1 South America
5.5.8.1.1 Market by Scanner Type
5.5.8.1.2 Market by Application
5.5.8.1.3 Market by End User
5.5.8.2 Middle East and Africa
5.5.8.2.1 Market by Scanner Type
5.5.8.2.2 Market by Application
5.5.8.2.3 Market by End User
5.6 Rest-of-the-World
5.6.1 Regional Overview
5.6.2 Driving Factors for Market Growth
5.6.3 Factors Challenging the Market
5.6.4 Key Companies
5.6.5 Scanner Type
5.6.6 Application
5.6.7 End User
5.6.8 Rest-of-the-World (by Region)
5.6.8.1 South America
5.6.8.1.1 Market by Scanner Type
5.6.8.1.2 Market by Application
5.6.8.1.3 Market by End User
5.6.8.2 Middle East and Africa
5.6.8.2.1 Market by Scanner Type
5.6.8.2.2 Market by Application
5.6.8.2.3 Market by End User
6.1 Next Frontiers
6.2 Geographic Assessment
6.3 Company Profiles
6.3.1 Fraunhofer Institute for Integrated Circuits IIS
6.3.1.1 Overview
6.3.1.2 Top Products/Product Portfolio
6.3.1.3 Top Competitors
6.3.1.4 Target Customers
6.3.1.5 Key Personnel
6.3.1.6 Analyst View
6.3.1.7 Market Share
6.3.2 Nikon Corporation
6.3.2.1 Overview
6.3.2.2 Top Products/Product Portfolio
6.3.2.3 Top Competitors
6.3.2.4 Target Customers
6.3.2.5 Key Personnel
6.3.2.6 Analyst View
6.3.2.7 Market Share
6.3.3 Baker Hughes Company
6.3.3.1 Overview
6.3.3.2 Top Products/Product Portfolio
6.3.3.3 Top Competitors
6.3.3.4 Target Customers
6.3.3.5 Key Personnel
6.3.3.6 Analyst View
6.3.3.7 Market Share
6.3.4 Lumafield
6.3.4.1 Overview
6.3.4.2 Top Products/Product Portfolio
6.3.4.3 Top Competitors
6.3.4.4 Target Customers
6.3.4.5 Key Personnel
6.3.4.6 Analyst View
6.3.4.7 Market Share
6.3.5 Comet (Xylon)
6.3.5.1 Overview
6.3.5.2 Top Products/Product Portfolio
6.3.5.3 Top Competitors
6.3.5.4 Target Customers
6.3.5.5 Key Personnel
6.3.5.6 Analyst View
6.3.5.7 Market Share
6.3.6 ZEISS
6.3.6.1 Overview
6.3.6.2 Top Products/Product Portfolio
6.3.6.3 Top Competitors
6.3.6.4 Target Customers
6.3.6.5 Key Personnel
6.3.6.6 Analyst View
6.3.6.7 Market Share
6.3.7 North Star Imaging Inc.
6.3.7.1 Overview
6.3.7.2 Top Products/Product Portfolio
6.3.7.3 Top Competitors
6.3.7.4 Target Customers
6.3.7.5 Key Personnel
6.3.7.6 Analyst View
6.3.7.7 Market Share
6.3.8 Mircea Tudor Scan Tech
6.3.8.1 Overview
6.3.8.2 Top Products/Product Portfolio
6.3.8.3 Top Competitors
6.3.8.4 Target Customers
6.3.8.5 Key Personnel
6.3.8.6 Analyst View
6.3.8.7 Market Share
6.3.9 OMRON Corporation
6.3.9.1 Overview
6.3.9.2 Top Products/Product Portfolio
6.3.9.3 Top Competitors
6.3.9.4 Target Customers
6.3.9.5 Key Personnel
6.3.9.6 Analyst View
6.3.9.7 Market Share
6.4 Other Key Companies
Table 1: Market Snapshot
Table 2: Opportunities across Region
Table 3: Trends Overview
Table 4: Vehicle Computer Tomography Market (by Region), $Billion, 2024-2034
Table 5: North America Vehicle Computer Tomography Market (by Scanner Type), $Billion, 2024-2034
Table 6: North America Vehicle Computer Tomography Market (by Application), $Billion, 2024-2034
Table 7: North America Vehicle Computer Tomography Market (by End User), $Billion, 2024-2034
Table 8: U.S. Vehicle Computer Tomography Market (by Scanner Type), $Billion, 2024-2034
Table 9: U.S. Vehicle Computer Tomography Market (by Application), $Billion, 2024-2034
Table 10: U.S. Vehicle Computer Tomography Market (by End User), $Billion, 2024-2034
Table 11: Canada Vehicle Computer Tomography Market (by Scanner Type), $Billion, 2024-2034
Table 12: Canada Vehicle Computer Tomography Market (by Application), $Billion, 2024-2034
Table 13: Canada Vehicle Computer Tomography Market (by End User), $Billion, 2024-2034
Table 14: Mexico Vehicle Computer Tomography Market (by Scanner Type), $Billion, 2024-2034
Table 15: Mexico Vehicle Computer Tomography Market (by Application), $Billion, 2024-2034
Table 16: Mexico Vehicle Computer Tomography Market (by End User), $Billion, 2024-2034
Table 17: Europe Vehicle Computer Tomography Market (by Scanner Type), $Billion, 2024-2034
Table 18: Europe Vehicle Computer Tomography Market (by Application), $Billion, 2024-2034
Table 19: Europe Vehicle Computer Tomography Market (by End User), $Billion, 2024-2034
Table 20: Germany Vehicle Computer Tomography Market (by Scanner Type), $Billion, 2024-2034
Table 21: Germany Vehicle Computer Tomography Market (by Application), $Billion, 2024-2034
Table 22: Germany Vehicle Computer Tomography Market (by End User), $Billion, 2024-2034
Table 23: France Vehicle Computer Tomography Market (by Scanner Type), $Billion, 2024-2034
Table 24: France Vehicle Computer Tomography Market (by Application), $Billion, 2024-2034
Table 25: France Vehicle Computer Tomography Market (by End User), $Billion, 2024-2034
Table 26: Italy Vehicle Computer Tomography Market (by Scanner Type), $Billion, 2024-2034
Table 27: Italy Vehicle Computer Tomography Market (by Application), $Billion, 2024-2034
Table 28: Italy Vehicle Computer Tomography Market (by End User), $Billion, 2024-2034
Table 29: Spain Vehicle Computer Tomography Market (by Scanner Type), $Billion, 2024-2034
Table 30: Spain Vehicle Computer Tomography Market (by Application), $Billion, 2024-2034
Table 31: Spain Vehicle Computer Tomography Market (by End User), $Billion, 2024-2034
Table 32: U.K. Vehicle Computer Tomography Market (by Scanner Type), $Billion, 2024-2034
Table 33: U.K. Vehicle Computer Tomography Market (by Application), $Billion, 2024-2034
Table 34: U.K. Vehicle Computer Tomography Market (by End User), $Billion, 2024-2034
Table 35: Rest-of-Europe Vehicle Computer Tomography Market (by Scanner Type), $Billion, 2024-2034
Table 36: Rest-of-Europe Vehicle Computer Tomography Market (by Application), $Billion, 2024-2034
Table 37: Rest-of-Europe Vehicle Computer Tomography Market (by End User), $Billion, 2024-2034
Table 38: China Vehicle Computer Tomography Market (by Scanner Type), $Billion, 2024-2034
Table 39: China Vehicle Computer Tomography Market (by Application), $Billion, 2024-2034
Table 40: China Vehicle Computer Tomography Market (by End User), $Billion, 2024-2034
Table 41: Japan Vehicle Computer Tomography Market (by Scanner Type), $Billion, 2024-2034
Table 42: Japan Vehicle Computer Tomography Market (by Application), $Billion, 2024-2034
Table 43: Japan Vehicle Computer Tomography Market (by End User), $Billion, 2024-2034
Table 44: India Vehicle Computer Tomography Market (by Scanner Type), $Billion, 2024-2034
Table 45: India Vehicle Computer Tomography Market (by Application), $Billion, 2024-2034
Table 46: India Vehicle Computer Tomography Market (by End User), $Billion, 2024-2034
Table 47: South Korea Vehicle Computer Tomography Market (by Scanner Type), $Billion, 2024-2034
Table 48: South Korea Vehicle Computer Tomography Market (by Application), $Billion, 2024-2034
Table 49: South Korea Vehicle Computer Tomography Market (by End User), $Billion, 2024-2034
Table 50: Rest-of-Asia-Pacific Vehicle Computer Tomography Market (by Scanner Type), $Billion, 2024-2034
Table 51: Rest-of-Asia-Pacific Vehicle Computer Tomography Market (by Application), $Billion, 2024-2034
Table 52: Rest-of-Asia-Pacific Vehicle Computer Tomography Market (by End User), $Billion, 2024-2034
Table 53: Rest-of-the-World Vehicle Computer Tomography Market (by Scanner Type), $Billion, 2024-2034
Table 54: Rest-of-the-World Vehicle Computer Tomography Market (by Application), $Billion, 2024-2034
Table 55: Rest-of-the-World Vehicle Computer Tomography Market (by End User), $Billion, 2024-2034
Table 56: South America Vehicle Computer Tomography Market (by Scanner Type), $Billion, 2024-2034
Table 57: South America Vehicle Computer Tomography Market (by Application), $Billion, 2024-2034
Table 58: South America Vehicle Computer Tomography Market (by End User), $Billion, 2024-2034
Table 59: Middle East and Africa Vehicle Computer Tomography Market (by Scanner Type), $Billion, 2024-2034
Table 60: Middle East and Africa Vehicle Computer Tomography Market (by Application), $Billion, 2024-2034
Table 61: Middle East and Africa Vehicle Computer Tomography Market (by End User), $Billion, 2024-2034
Table 62: Market Share
Figure 1: Vehicle Computer Tomography Market (by Scenario), $Billion, 2025, 2028, and 2034
Figure 2: Vehicle Computer Tomography Market (by Region), $Billion, 2024, 2027, and 2034
Figure 3: Vehicle Computer Tomography Market (by Scanner Type), $Billion, 2024, 2027, and 2034
Figure 4: Vehicle Computer Tomography Market (by Application), $Billion, 2024, 2027, and 2034
Figure 5: Vehicle Computer Tomography Market (by End User), $Billion, 2024, 2027, and 2034
Figure 6: Competitive Landscape Snapshot
Figure 7: Supply Chain Analysis
Figure 8: Value Chain Analysis
Figure 9: Patent Analysis (by Country), January 2021-April 2025
Figure 10: Patent Analysis (by Company), January 2021-April 2025
Figure 11: Impact Analysis of Market Navigating Factors, 2024-2034
Figure 12: U.S. Vehicle Computer Tomography Market, $Billion, 2024-2034
Figure 13: Canada Vehicle Computer Tomography Market, $Billion, 2024-2034
Figure 14: Mexico Vehicle Computer Tomography Market, $Billion, 2024-2034
Figure 15: Germany Vehicle Computer Tomography Market, $Billion, 2024-2034
Figure 16: France Vehicle Computer Tomography Market, $Billion, 2024-2034
Figure 17: Italy Vehicle Computer Tomography Market, $Billion, 2024-2034
Figure 18: Spain Vehicle Computer Tomography Market, $Billion, 2024-2034
Figure 19: U.K. Vehicle Computer Tomography Market, $Billion, 2024-2034
Figure 20: Rest-of-Europe Vehicle Computer Tomography Market, $Billion, 2024-2034
Figure 21: China Vehicle Computer Tomography Market, $Billion, 2024-2034
Figure 22: Japan Vehicle Computer Tomography Market, $Billion, 2024-2034
Figure 23: India Vehicle Computer Tomography Market, $Billion, 2024-2034
Figure 24: South Korea Vehicle Computer Tomography Market, $Billion, 2024-2034
Figure 25: Rest-of-Asia-Pacific Vehicle Computer Tomography Market, $Billion, 2024-2034
Figure 26: South America Vehicle Computer Tomography Market, $Billion, 2024-2034
Figure 27: Middle East and Africa Vehicle Computer Tomography Market, $Billion, 2024-2034
Figure 28: Strategic Initiatives (by Company), 2021-2025
Figure 29: Share of Strategic Initiatives, 2021-2025
Figure 30: Data Triangulation
Figure 31: Top-Down and Bottom-Up Approach
Figure 32: Assumptions and Limitations
Vehicle Computer Tomography Market Report Coverage
Global Vehicle Computer Tomography Market |
|||
Base Year |
2024 |
Market Size in 2024 |
$1.21 Billion |
Forecast Period |
2025-2034 |
Value Projection and Estimation by 2034 |
$2.97 Billion |
CAGR during Forecast Period |
8.76% |
|
|
Vehicle Computer Tomography Market Key Players and Competition Synopsis
The vehicle computer tomography market features a competitive landscape shaped by established industrial imaging leaders and innovative automotive inspection technology providers. Key global companies such as Nikon Corporation, Lumafield, Comet (Xylon), ZEISS, North Star Imaging Inc., and Fraunhofer Institute for Integrated Circuits IIS play pivotal roles in advancing vehicle-grade computed tomography solutions. These players emphasize the development of high-resolution, fast CT scanners with AI-enabled defect detection and integration into automotive manufacturing workflows. Alongside these established firms, emerging technology companies are contributing novel portable and automated CT scanning systems tailored for electric vehicle battery analysis and quality assurance. Competition in the vehicle computer tomography market is driven by strategic collaborations with automotive OEMs, continuous product innovation, and expansion into emerging geographic markets. As the vehicle computer tomography market grows, participants focus on delivering scalable, cost-effective solutions that meet evolving automotive safety and performance standards
Some prominent names established in the vehicle computer tomography market are:
• Fraunhofer Institute for Integrated Circuits IIS
• Nikon Corporation
• Baker Hughes Company
• Lumafield
• Comet (Xylon)
• ZEISS
• North Star Imaging Inc.
• Mircea Tudor Scan Tech
• OMRON Corporation
Companies that are not a part of the previously mentioned pool have been well represented across different sections of the report (wherever applicable).
Key Questions Answered in this Report:
• What are the main factors driving the demand for global vehicle computer tomography market?
• What are the major patents filed by the companies active in the global vehicle computer tomography market?
• Who are the key players in the global vehicle computer tomography market , and what are their respective market shares?
• What partnerships or collaborations are prominent among stakeholders in the global vehicle computer tomography market?
• What are the strategies adopted by the key companies to gain a competitive edge in global vehicle computer tomography market?
• What is the futuristic outlook for the global vehicle computer tomography market in terms of growth potential?
• What is the current estimation of the global vehicle computer tomography market and what growth trajectory is projected from 2025 to 2034?
• Which application, and product segment is expected to lead the market over the forecast period (2025-2034)?
• Which regions demonstrate the highest adoption rates for global vehicle computer tomography market , and what factors contribute to their leadership?
Vehicle Computer Tomography Market Industry and Technology Overview
The vehicle computer tomography market represents a vital segment within the broader industrial CT and non-destructive testing ecosystem. CT technology continues to evolve with advancements in multi-slice imaging, detector sensitivity, and AI-based image processing algorithms. Vehicle computer tomography systems are essential for internal inspection of automotive components such as engines, transmissions, battery packs, and castings without disassembly. Recent innovations including cone-beam CT and nano-CT have significantly enhanced image resolution and scan speed, expanding their applicability in vehicle manufacturing and R&D. Artificial intelligence and machine learning integration enable automated defect recognition, increasing throughput and reducing human error. Investment in R&D focuses on developing high-speed, cost-efficient CT systems tailored for automotive quality control and electric vehicle battery diagnostics. The vehicle computer tomography market benefits from increasing adoption of non-destructive testing to improve manufacturing yield and safety compliance.
Global Vehicle Computer Tomography Market Lifecycle Stage
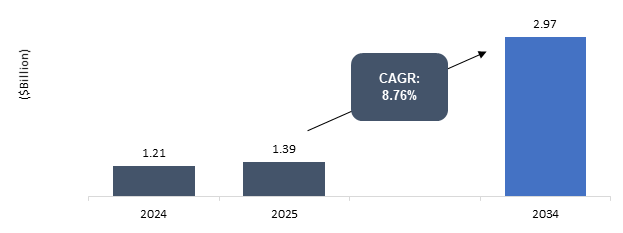
Currently, the vehicle computer tomography market is experiencing robust growth, supported by rising automotive production volumes and stringent safety and quality regulations worldwide. The market has reached advanced technology readiness levels, with growing adoption in North America, Europe, and Asia-Pacific regions. The U.S. automotive sector notably drives demand due to its focus on innovation and quality assurance. Strategic partnerships among CT scanner manufacturers, automotive OEMs, and research institutions foster accelerated development of customized scanning solutions. Regulatory frameworks related to vehicle safety and environmental standards shape market dynamics. Continued advancements in automation, digital analytics, and AI are reducing operational barriers and enabling in-line integration of CT systems in vehicle manufacturing processes. The vehicle computer tomography market is projected to sustain strong growth through the next decade, driven by increasing electric vehicle production and demand for lightweight, defect-free components.
Vehicle Computer Tomography Market Segmentation:
Segmentation 1: by Scanner Type
• Industrial CT Scanners
• Mobile CT Scanners
• Automated CT Scanners
• CT with AI Analysis
Segmentation 2: by Application
• Quality Control
• Prototype Development
• Material Analysis
• Non-Destructive Testing
• Structural Integrity
Segmentation 3: by End User
• Original Equipment Manufacturers
• Automotive Aftermarket and Maintenance Service Providers
• Research and Development Institutions
• Tier 1 and Tier 2 Automotive Suppliers
Segmentation 4: by Region
• North America - U.S., Canada, and Mexico
• Europe - Germany, France, Italy, Spain, U.K., and Rest-of-Europe
• Asia-Pacific - China, Japan, South Korea, India, and Rest-of-Asia-Pacific
• Rest-of-the-World - South America and Middle East and Africa
Demand – Drivers and Limitations
The following are the demand drivers for the vehicle computer tomography market:
• Increasing automotive industry focus on non-destructive testing and quality assurance
• Growing demand for electric vehicles (EVs)
• Regulatory mandates for vehicle safety and component traceability
• Technological advancements in AI integration and faster scanning capabilities
The vehicle computer tomography market is expected to face some limitations as well due to the following challenges:
• High initial investment and operational costs associated with CT systems
• Requirement for specialized technical expertise in data interpretation
• Integration complexities with existing automotive manufacturing lines
Analyst Thoughts
According to Debraj Chakraborty, Principal Analyst, BIS Research, “The vehicle computer tomography market is positioned for significant growth as automotive manufacturers worldwide prioritize enhanced product quality, safety, and innovation. Advances in CT technology, combined with AI-driven analytics, are revolutionizing defect detection and manufacturing process optimization. Companies focusing on scalable, automated CT solutions with reduced costs and increased throughput will lead the market. Strategic partnerships with OEMs and investment in application-specific innovations, particularly in electric vehicle battery analysis, will be critical for sustained competitiveness in the vehicle computer tomography market.”
Vehicle Computer Tomography Market - A Global and Regional Analysis
Focus on Scanner Type, Application, End User, and Regional Analysis - Analysis and Forecast, 2025-2034
Frequently Asked Questions
Ans: Vehicle computer tomography is an advanced non-destructive imaging technique that uses X-ray computed tomography to produce detailed three-dimensional internal images of vehicle components. This technology facilitates precise defect detection, structural analysis, and quality assurance in automotive manufacturing and maintenance.
Ans: The vehicle computer tomography market is advancing rapidly, driven by several key trends. The integration of artificial intelligence (AI) and machine learning enables automated defect recognition and enhanced image analysis, improving efficiency and accuracy. Increasing demand for electric vehicle battery inspection has expanded CT applications, necessitating high-resolution, high-speed scanning systems. Portable and automated CT scanners are gaining traction for use in aftermarket diagnostics and in-line manufacturing inspection. Additionally, advances in multi-slice and cone-beam CT technologies contribute to improved imaging capabilities and reduced scan times.
Ans: Leading companies are investing heavily in research and development to innovate CT scanning technologies with higher resolution, faster throughput, and AI-driven analytics. Strategic partnerships with automotive OEMs and suppliers enhance product customization and integration capabilities. Firms are broadening their geographic footprint to capture emerging markets and developing comprehensive software solutions to simplify data interpretation and improve operational workflows. Emphasis on modular and scalable CT systems facilitates adoption across various automotive applications, from component manufacturing to electric vehicle battery analysis.
Ans: New entrants should prioritize innovation in AI-enabled imaging and automated defect detection, develop portable and cost-efficient CT scanning solutions, and focus on electric vehicle battery inspection technologies. Building strong collaborations with automotive manufacturers and research institutions will support tailored product development and faster market acceptance. Offering robust training and after-sales support will also enhance customer satisfaction and retention.
Ans: This report provides detailed competitive benchmarking of leading global players, comprehensive segmentation by scanner type, application, end user, and region, along with in-depth analysis of emerging trends, technological advancements, and market dynamics. It delivers a thorough understanding of the vehicle computer tomography market landscape, enabling stakeholders to make informed strategic decisions.
Ans: This report is essential for automotive manufacturers, CT scanner producers, quality assurance and testing service providers, research organizations, and investors focused on the automotive inspection, non-destructive testing, and imaging technology sectors.