A quick peek into the report
Table of Contents
1.1 Market Definition
1.2 Market Evolution
1.3 Value Chain Analysis
1.4 Market Snapshot
2.1 Overview
2.2 Impact Analysis
2.3 Market Drivers
2.3.1 Increased Demand for 3D Holographic Displays in Creative Economy
2.3.2 Growing Adoption of Medical Imaging in the Healthcare Industry
2.3.3 Rising Industrial Automation with Industry 4.0 Applications
2.4 Market Restraints
2.4.1 High Manufacturing Cost of Display Technologies
2.4.2 Presence of Alternatives to Holographic Displays and Low Adoption Rate
2.4.3 Less Effective Projection Under Sunlight
2.5 Market Opportunities
2.5.1 Rapidly Advancing Smartphone and Tablet Market
2.5.2 Rise of 5G and 6G Communication Technologies
3.1 Key Strategies and Developments
3.1.1 Partnerships, Collaborations, and Joint Ventures
3.1.2 Product Launches and Developments
3.1.3 Business Expansions and Contracts
3.1.4 Mergers and Acquisitions
3.1.5 Others (Awards and Recognition)
3.2 Competitive Benchmarking of 3D Holographic Display & Services Companies
4.1 Market Trends
4.1.1 Gearless Holographic Displays
4.1.2 Growth of AR and MR Technologies
4.1.3 Growing Demand for 3D Content
4.1.4 Free-Floating Image
4.2 Display Technologies
4.2.1 Laser
4.2.2 Electroholography
4.2.3 Full Parallax/HPO/VPO
4.2.4 MEMs, LCDs, DMDs, and LEDs
4.2.5 Light Field Technology
4.2.6 Waveguide Technology
4.3 Key Use Cases
4.3.1 Holographic Phone Call
4.3.2 Holographic Medical Imaging or Medical Visualizing
4.3.3 No-Lograms and Laser Plasma Projection
4.4 Associations and Consortiums
4.5 Investment and Funding Landscape
4.6 Patent Analysis
4.6.1 Patent Analysis (by Status)
4.6.2 Patent Analysis (by Objective)
4.6.3 Patent Analysis (by Product Type)
4.6.4 Patent Analysis (by Application)
4.6.5 Patent Analysis (by Applicant Profile)
4.6.6 Patent Analysis (by Patent Office)
5.1 Market Overview
5.2 Content Creation Services
5.3 Support Services
5.4 Rental Services
6.1 Market Overview
6.2 Spinning LED
6.3 Pseudo Holographic Display
6.3.1 Pepper’s Ghost Display
6.3.2 Mid-Air and Ariel Projection
6.3.3 Holographic Mesh
6.4 Planar and Television Type Display
6.4.1 Non-Head Tracking Display
6.4.2 Head Tracking Displays
6.5 Heads-Up Display (HUD)
6.6 Volumetric Display
6.6.1 Swept Volume Display
6.6.2 Static Volume Display
6.6.3 Free Space Displays
7.1 Market Overview
7.2 Retail Display
7.3 Trade Show, Conference, and Exhibition
7.4 Digital Signage
7.5 Navigation
7.5.1 Automotive
7.5.2 Avionics
7.6 Holographic Medical Imaging
7.7 Others
8.1 Market Overview
8.2 Retail
8.3 Media and Advertisement
8.4 Exhibition Industry
8.5 Automotive
8.6 Healthcare
8.7 Defense & Aerospace and Aviation
8.8 Consumer Electronics
8.9 Others
9.1 Market Overview
9.2 Display-as-a-Product
9.3 Display-as-a-Service
10.1 Market Overview
10.2 North America
10.2.1 North America 3D Holographic Display and Services Market (by Product Type)
10.2.2 North America 3D Holographic Display and Services Market (by Country)
10.2.2.1 U.S.
10.2.2.1.1 U.S. 3D Holographic Display and Services Market (by Product Type)
10.2.2.2 Canada
10.2.2.2.1 Canada 3D Holographic Display and Services Market (by Product Type)
10.2.2.3 Mexico
10.2.2.3.1 Mexico 3D Holographic Display and Services Market (by Product Type)
10.3 Europe
10.3.1 Europe 3D Holographic Display and Services Market (by Product Type)
10.3.2 Europe 3D Holographic Display and Services Market (by Country)
10.3.2.1 Germany
10.3.2.1.1 Germany 3D Holographic Display and Services Market (by Product Type)
10.3.2.2 Netherlands
10.3.2.2.1 Netherlands 3D Holographic Display and Services Market (by Product Type)
10.3.2.3 Belgium
10.3.2.3.1 Belgium 3D Holographic Display and Services Market (by Product Type)
10.3.2.4 Switzerland
10.3.2.4.1 Switzerland 3D Holographic Display and Services Market (by Product Type)
10.3.2.5 France
10.3.2.5.1 France 3D Holographic Display and Services Market (by Product Type)
10.3.2.6 Sweden
10.3.2.6.1 Sweden 3D Holographic Display and Services Market (by Product Type)
10.3.2.7 Rest-of-Europe
10.3.2.7.1 Rest-of-Europe 3D Holographic Display and Services Market (by Product Type)
10.4 U.K.
10.4.1 U.K. 3D Holographic Display and Services Market (by Product Type)
10.5 Asia-Pacific and Japan
10.5.1 Asia-Pacific and Japan 3D Holographic Display and Services Market (by Product Type)
10.5.2 Asia-Pacific and Japan 3D Holographic Display and Services Market (by Country)
10.5.2.1 Japan
10.5.2.1.1 Japan 3D Holographic Display and Services Market (by Product Type)
10.5.2.2 South Korea
10.5.2.2.1 South Korea 3D Holographic Display and Services Market (by Product Type)
10.5.2.3 India
10.5.2.3.1 India 3D Holographic Display and Services Market (by Product Type)
10.5.2.4 Australia and New Zealand
10.5.2.4.1 Australia and New Zealand 3D Holographic Display and Services Market (by Product Type)
10.5.2.5 Taiwan
10.5.2.5.1 Taiwan 3D Holographic Display and Services Market (by Product Type)
10.5.2.6 Rest-of-Asia-Pacific and Japan
10.5.2.6.1 Rest-of-Asia-Pacific and Japan 3D Holographic Display and Services Market (by Product Type), $Million, 2019-2025
10.6 China
10.6.1 China 3D Holographic Display and Services Market (by Product Type)
10.7 Middle East and Africa
10.7.1 Middle East and Africa 3D Holographic Display and Services Market (by Product Type)
10.7.2 Middle East and Africa 3D Holographic Display and Services Market (by Country)
10.7.2.1 U.A.E.
10.7.2.1.1 U.A.E. 3D Holographic Display and Services Market (by Product Type)
10.7.2.2 Israel
10.7.2.2.1 Israel 3D Holographic Display and Services Market (by Product Type)
10.7.2.3 Rest-of-Middle East and Africa
10.7.2.3.1 Rest-of-Middle East and Africa 3D Holographic Display and Services Market (by Product Type)
10.8 South America
10.8.1 South America 3D Holographic Display and Services Market (by Product Type)
10.8.2 South America 3D Holographic Display and Services Market (by Country)
10.8.2.1 Brazil
10.8.2.1.1 Brazil 3D Holographic Display and Services Market (by Product Type)
10.8.2.2 Argentina
10.8.2.2.1 Argentina 3D Holographic Display and Services Market (by Product Type)
10.8.2.3 Rest-of-South America
10.8.2.3.1 Rest-of-South America 3D Holographic Display and Services Market (by Product Type)
11.1 Overview
Spinning Led Display Manufacturers
11.2 KINO-MO LTD (HYPERVSN).
11.2.1 Company Overview
11.2.2 Role of KINO-MO LTD (HYPERVSN) in Global 3D Holographic Display and Services Market
11.2.3 SWOT ANALYSIS
11.3 FURSOL CORPORATION LTD.
11.3.1 Company Overview
11.3.2 Role of Fursol Corporation Ltd. in Global 3D Holographic Display and Services Market
11.3.3 SWOT ANALYSIS
11.4 SHENZHEN WIIKK TECHNOLOGY CO., LTD.
11.4.1 Company Overview
11.4.2 Role of Shenzhen Wiikk Technology Co., Ltd. in Global 3D Holographic Display and Services Market
11.4.3 SWOT ANALYSIS
11.5 SHENZHEN FEITIANXIA TECHNOLOGY LTD. (IDISKK)
11.5.1 Company Overview
11.5.2 Role of Shenzhen Feitianxia Technology Ltd. (iDiskk) in Global 3D Holographic Display and Services Market
11.5.3 SWOT ANALYSIS
11.6 NANJING DSEELAB DIGITAL TECHNOLOGY CO., LTD
11.6.1 Company Overview
11.6.2 Role of Nanjing DSeeLab Digital Technology Co, Ltd. in Global 3D Holographic Display and Services Market
11.6.3 SWOT ANALYSIS
Pseudo Holographic Display Manufacturers
11.7 Realfiction Holding AB
11.7.1 Company Overview
11.7.2 Role of Realfiction Holding AB in Global 3D Holographic Display and Services Market
11.7.3 Financials
11.7.4 SWOT ANALYSIS
11.8 PROVISION HOLDING, INC.
11.8.1 Company Overview
11.8.2 Role of Provision Holding, Inc. in Global 3D Holographic Display and Services Market
11.8.3 Financials
11.8.4 SWOT ANALYSIS
11.9 MDH HOLOGRAM
11.9.1 Company Overview
11.9.2 Role of MDH Hologram in Global 3D Holographic Display and Services Market
11.9.3 SWOT ANALYSIS
11.10 CPP STUDIOS GMBH (VIZOO)
11.10.1 Company Overview
11.10.2 CPP Studios GmbH in Global 3D Holographic Display and Services Market
11.10.3 SWOT ANALYSIS
Planar and Television Type Manufacturers
11.11 LOOKING GLASS FACTORY INC.
11.11.1 Company Overview
11.11.2 Role of Looking Glass factory Inc. in Global 3D Holographic Display and Services Market
11.11.3 SWOT ANALYSIS
11.12 HOLOXICA LTD
11.12.1 Company Overview
11.12.2 Role of Holoxica Ltd. in Global 3D Holographic Display and Services Market
11.12.3 SWOT ANALYSIS
11.13 Holografika Kft.
11.13.1 Company Overview
11.13.2 Role of Holografika Kft in Global 3D Holographic Display and Services Market
11.13.3 SWOT ANALYSIS
11.14 LightSpace Technologies Inc.
11.14.1 Company Overview
11.14.2 Role of LightSpace Technologies Inc. in Global 3D Holographic Display and Services Market
11.14.3 SWOT ANALYSIS
AR-Based HUD Manufactures and Developers
11.15 BAE Systems
11.15.1 Company Overview
11.15.2 Role of BAE Systems in Global 3D Holographic Display and Services Market
11.15.3 Financials
11.15.4 SWOT ANALYSIS
11.16 ENVISICS
11.16.1 Company Overview
11.16.2 Role of Envisics in Global 3D Holographic Display and Services Market
11.16.3 SWOT ANALYSIS
11.17 WAYRAY AG
11.17.1 Company Overview
11.17.2 Role of WayRay AG in Global 3D Holographic Display and Services Market
11.17.3 SWOT ANALYSIS
11.18 CY Vision
11.18.1 Company Overview
11.18.2 Role of CY Vision in Global 3D Holographic Display and Services Market
11.18.3 SWOT ANALYSIS
Multiple Offerings
11.19 GLIMM INTERNATIONAL BV
11.19.1 Company Overview
11.19.2 Role of Glimm International BV in Global 3D Holographic Display and Services Market
11.19.3 SWOT ANALYSIS
11.20 SHENZHEN SMX DISPLAY TECHNOLOGY CO., LTD.
11.20.1 Company Overview
11.20.2 Role of Shenzhen SMX Display Technology Co., LTD. in Global 3D Holographic Display and Services Market
11.20.3 SWOT ANALYSIS
Volumetric Display Companies
11.21 Voxon Photonics.
11.21.1 Company Overview
11.21.2 Role of Voxon Photonics in Global 3D Holographic Display and Services Market
Other Display Manufacturing Companies and Start-ups
11.22 Holofil
11.22.1 Company Overview
11.22.2 Role of Holofil in Global 3D Holographic Display and Services Market
11.23 MAJIX.TECH
11.23.1 Company Overview
11.23.2 Role of MAJIX.TECH in Global 3D Holographic Display and Services Market
11.24 HUDWAY.
11.24.1 Company Overview
11.24.2 Role of HUDWAY in Global 3D Holographic Display and Services Market
11.25 Realview Imaging Ltd.
11.25.1 Company Overview
11.25.2 Role of Realview Imaging Ltd. in Global 3D Holographic Display and Services Market
11.26 DigiLens Inc.
11.26.1 Company Overview
11.26.2 Role of DigiLens Inc. in Global 3D Holographic Display and Services Market
11.27 Burton Inc.
11.27.1 Company Overview
11.27.2 Role of Burton Inc. in Global 3D Holographic Display and Services Market
11.28 HoloLamp.
11.28.1 Company Overview
11.28.2 Role of HoloLamp in Global 3D Holographic Display and Services Market
11.29 Off The Wall Agency.
11.29.1 Company Overview
11.29.2 Role of Off The Wall Agency in Global 3D Holographic Display and Services Market
11.30 Leia Inc.
11.30.1 Company Overview
11.30.2 Role of Leia Inc. in Global 3D Holographic Display and Services Market
11.31 SeeReal Technologies.
11.31.1 Company Overview
11.31.2 Role of SeeReal Technologies in Global 3D Holographic Display and Services Market
11.32 Light Field Lab, Inc.
11.32.1 Company Overview
11.32.2 Role of Light Field Lab, Inc. in Global 3D Holographic Display and Services Market
11.33 EXTEND3D GmbH
11.33.1 Company Overview
11.33.2 Role of EXTEND3D GmbH in Global 3D Holographic Display and Services Market
11.34 Leia Display System
11.34.1 Company Overview
11.34.2 Role of Leia Display System in Global 3D Holographic Display and Services Market
11.35 HD FALCON
11.35.1 Company Overview
11.35.2 Role of HD FALCON in Global 3D Holographic Display and Services Market
11.36 PIXELO - 3D HOLOGRAPHIC DISPLAY (RIVOX)
11.36.1 Company Overview
11.36.2 Role of Pixelo - 3D Holographic Display (Rivox) in Global 3D Holographic Display and Services Market
11.37 HoPro
11.37.1 Company Overview
11.37.2 Role of HoPro in Global 3D Holographic Display and Services Market
11.38 HOLO Industries
11.38.1 Company Overview
11.38.2 Role of HOLO Industries in Global 3D Holographic Display and Services Market
11.39 Fogio Inc
11.39.1 Company Overview
11.39.2 Role of Fogio Inc in the Global 3D Holographic Display and Services Market
11.40 HOLOBOX HOLOGRAPHY
11.40.1 Company Overview
11.40.2 Role of HOLOBOX HOLOGRAPHY in Global 3D Holographic Display and Services Market
11.41 SuperbHolo
11.41.1 Company Overview
11.41.2 Role of SuperbHolo in Global 3D Holographic Display and Services Market
Software Companies Supporting Holographic Display Market.
11.42 VividQ
11.42.1 Company Overview
11.42.2 Role of VividQ in Global 3D Holographic Display and Services Market
11.43 Otoy
11.43.1 Company Overview
11.43.2 Role of Otoy in Global 3D Holographic Display and Services Market
11.44 Visby
11.44.1 Company Overview
11.44.2 Role of Visby in Global 3D Holographic Display and Services Market
12.1 Report Scope
12.1.1 Global 3D Holographic Display and Services Market Segmentation
12.2 Global 3D Holographic Display and Services Market Research Methodology
12.2.1 Assumptions
12.2.2 Limitations
12.2.3 Primary Data Sources
12.2.4 Secondary Data Sources
12.2.5 Data Triangulation
12.2.6 Market Estimation and Forecast
13.1 Annexure A: List of Key Strategies and Developments in Global 3D Holographic Display and Services Market (January 2017-Aug 2020)
13.2 Annexure B: List of Patents in Global 3D Holographic Display and Services Market (January 2017 - August 2020)
Table 2.1: Impact Analysis of Market Drivers
Table 4.1: Key Attributes of Various Display Technologies
Table 4.2: Key Consortiums and Associations in Global 3D Holographic Display and Services Market
Table 5.1: Global 3D Holographic Display and Services Market (by Value-Added Services), $Million, 2019-2025
Table 5.2: Key Content Creating Companies
Table 5.3: Key Rental Service Companies
Table 6.1: 3D Holographic Display and Services Market (by Product Type), $Million, 2019-2025
Table 6.2: 3D Holographic Display and Services Market (by Product Type), Units, 2019-2025
Table 6.3: Key Players Serving in Spinning LED Segment and Their Products
Table 6.4: Key Players Serving in Pseudo Holographic Display Segment and Their Products
Table 6.5: Key Players Serving in Planar and Television Type Display Segment and Their Products
Table 6.6: Key Players Serving in HUD Segment and Their Products
Table 6.7: Key Players Serving in Volumetric Display and Their Products
Table 7.1: 3D Holographic Display and Services Market (by Application), $Million, 2019-2025
Table 7.2: Applications 3D Holographic Display and Services Market, Units, 2019-2025
Table 7.3: Key Players Serving Retail Display Segment and Their Products
Table 7.4: Key Players Serving Trade Show, Conference, and Exhibition Segment and Their Products
Table 7.5: Key Players Serving Digital Signage Applications and Their Products
Table 7.6: Key Players Serving the HUD Navigation Segment, and Their Products
Table 7.7: Key Players Serving Holographic Medical Imaging Segment and Their Products
Table 7.8: Key Players Serving Others Segment and Their Products
Table 8.1: 3D Holographic Display and Services Market (by End-Use Industry), $Million, 2019-2025
Table 8.2: 3D Holographic Display and Services Market (by End-Use Industry), Units, 2019-2025
Table 8.3: Key Players Serving Retail Segment and Their Products
Table 8.4: Key Players Serving Media and Advertisement Segment and Their Products
Table 8.5: Key Players Serving Exhibition Industry Segment and Their Products
Table 8.6: Key Players Serving Automotive Segment and Their Products
Table 8.7: Key Players Serving Healthcare Industry Segment and Their Products
Table 8.8: Key Players Serving Defense & Aerospace and Aviation Segment and Their Products
Table 8.9: Key Players Serving Consumer Electronics Segment and Their Products
Table 8.10: Key Players Serving Others Segment and Their Products
Table 9.1: Global 3D Holographic Display and Services Market (by Business Model), $Million, 2019-2025
Table 9.2: Global 3D Holographic Display and Services Market (by Business Model), Units, 2019-2025
Table 9.3: Key Players with Display-as-a-Product Business Model and Their Products
Table 9.4: Key Players with Display As A Product Business Model and their Products
Table 10.1: Global 3D Holographic Display and Services Market (by Region), $Million, 2019-2025
Table 10.2: Global 3D Holographic Display and Services Market (by Region), Units, 2019-2025
Table 10.3: North America 3D Holographic Display and Services Market (by Product Type), $Million, 2019-2025
Table 10.4: North America 3D Holographic Display and Services Market (by Product Type), Units, 2019-2025
Table 10.5: Key Players Serving the Retail Segment and Their Products
Table 10.6: North America 3D Holographic Display and Services Market (by Country), $Million, 2019-2025
Table 10.7: North America 3D Holographic Display and Services Market (by Country), $Million, 2019-2025
Table 10.8: U.S. 3D Holographic Display and Services Market (by Product Type), $Million, 2019-2025
Table 10.9: U.S. 3D Holographic Display and Services Market (by Product Type), Units, 2019-2025
Table 10.10: Canada 3D Holographic Display and Services Market (by Product Type), $Million, 2019-2025
Table 10.11: Canada 3D Holographic Display and Services Market (by Product Type), Units, 2019-2025
Table 10.12: Mexico 3D Holographic Display and Services Market (by Product Type), $Million, 2019-2025
Table 10.13: Mexico 3D Holographic Display and Services Market (by Product Type), Units, 2019-2025
Table 10.14: Europe 3D Holographic Display and Services Market (by Product Type), $Million, 2019-2025
Table 10.15: Europe 3D Holographic Display and Services Market (by Product Type), Units, 2019-2025
Table 10.16: Key Players Serving the Retail Segment and Their Products
Table 10.17: Europe and Japan 3D Holographic Display and Services Market (by Country), $Million, 2019-2025
Table 10.18: Europe 3D Holographic Display and Services Market (by Country), $Million, 2019-2025
Table 10.19: Germany 3D Holographic Display and Services Market (by Product Type), $Million, 2019-2025
Table 10.20: Germany 3D Holographic Display and Services Market (by Product Type), Units, 2019-2025
Table 10.21: Netherlands 3D Holographic Display and Services Market (by Product Type), $Million, 2019-2025
Table 10.22: Netherlands 3D Holographic Display and Services Market (by Product Type), Units, 2019-2025
Table 10.23: Belgium 3D Holographic Display and Services Market (by Product Type), $Million, 2019-2025
Table 10.24: Belgium 3D Holographic Display and Services Market (by Product Type), Units, 2019-2025
Table 10.25: Switzerland 3D Holographic Display and Services Market (by Product Type), $Million, 2019-2025
Table 10.26: Switzerland 3D Holographic Display and Services Market (by Product Type), Units, 2019-2025
Table 10.27: France 3D Holographic Display and Services Market (by Product Type), $Million, 2019-2025
Table 10.28: France 3D Holographic Display and Services Market (by Product Type), Units, 2019-2025
Table 10.29: Sweden 3D Holographic Display and Services Market (by Product Type), $Million, 2019-2025
Table 10.30: Sweden 3D Holographic Display and Services Market (by Product Type), Units, 2019-2025
Table 10.31: Rest-of-Europe 3D Holographic Display and Services Market (by Product Type), $Million, 2019-2025
Table 10.32: Rest-of-Europe 3D Holographic Display and Services Market (by Product Type), Units, 2019-2025
Table 10.33: U.K. 3D Holographic Display and Services Market (by Product Type), $Million, 2019-2025
Table 10.34: U.K. 3D Holographic Display and Services Market (by Product Type), $Million, 2019-2025
Table 10.35: Key Players in U.K. and Their Products
Table 10.36: Asia-Pacific and Japan 3D Holographic Display and Services Market (by Product Type), $Million, 2019-2025
Table 10.37: Asia-Pacific and Japan 3D Holographic Display and Services Market (by Product Type), Units, 2019-2025
Table 10.38: Key Players in Asia-Pacific and Japan and Their Products
Table 10.39: Asia-Pacific and Japan 3D Holographic Display and Services Market (by Country), $Million, 2019-2025
Table 10.40: Asia-Pacific and Japan 3D Holographic Display and Services Market (by Country), Units, 2019-2025
Table 10.41: Japan 3D Holographic Display and Services Market (by Product Type), $Million, 2019-2025
Table 10.42: Japan 3D Holographic Display and Services Market (by Product Type), Units, 2019-2025
Table 10.43: South Korea 3D Holographic Display and Services Market (by Product Type), $Million, 2019-2025
Table 10.44: South Korea 3D Holographic Display and Services Market (by Product Type), Units, 2019-2025
Table 10.45: India 3D Holographic Display and Services Market (by Product Type), $Million, 2019-2025
Table 10.46: India 3D Holographic Display and Services Market (by Product Type), Units, 2019-2025
Table 10.47: Australia and New Zealand 3D Holographic Display and Services Market (by Product Type), $Million, 2019-2025
Table 10.48: Australia and New Zealand 3D Holographic Display and Services Market (by Product Type), Units, 2019-2025
Table 10.49: Taiwan 3D Holographic Display and Services Market (by Product Type), $Million, 2019-2025
Table 10.50: Taiwan 3D Holographic Display and Services Market (by Product Type), Units, 2019-2025
Table 10.51: Rest-of-Asia-Pacific and Japan 3D Holographic Display and Services Market (by Product Type), $Million, 2019-2025
Table 10.52: Taiwan 3D Holographic Display and Services Market (by Product Type), Units, 2019-2025
Table 10.53: China 3D Holographic Display and Services Market (by Product Type), $Million, 2019-2025
Table 10.54: China 3D Holographic Display and Services Market (by Product Type), $Million, 2019-2025
Table 10.55: Key Players in China and their Products
Table 10.56: Middle East and Africa 3D Holographic Display and Services Market (by Product Type), $Million, 2019-2025
Table 10.57: Middle East and Africa 3D Holographic Display and Services Market (by Product Type), Units, 2019-2025
Table 10.58: Key Players Middle East and Africa and Their Products
Table 10.59: Middle-East & Africa 3D Holographic Display and Services Market (by Country), $Million, 2019-2025
Table 10.60: Middle-East & Africa 3D Holographic Display and Services Market (by Country), Units, 2019-2025
Table 10.61: U.A.E. 3D Holographic Display and Services Market (by Product Type), $Million, 2019-2025
Table 10.62: U.A.E. 3D Holographic Display and Services Market (by Product Type), Units, 2019-2025
Table 10.63: Israel 3D Holographic Display and Services Market (by Product Type), $Million, 2019-2025
Table 10.64: Israel 3D Holographic Display and Services Market (by Product Type), Units, 2019-2025
Table 10.65: Rest-of-Middle East and Africa 3D Holographic Display and Services Market (by Product Type), $Million, 2019-2025
Table 10.66: Rest of Middle East and Africa 3D Holographic Display and Services Market (by Product Type), Units, 2019-2025
Table 10.67: South America 3D Holographic Display and Services Market (by Product Type), $Million, 2019-2025
Table 10.68: South America 3D Holographic Display and Services Market (by Product Type), Units, 2019-2025
Table 10.69: Key Players in South America and their Products
Table 10.70: South America 3D Holographic Display and Services Market (by Country), $Million, 2019-2025
Table 10.71: South America 3D Holographic Display and Services Market (by Country), Units, 2019-2025
Table 10.72: Brazil 3D Holographic Display and Services Market (by Product Type), $Million, 2019-2025
Table 10.73: Brazil 3D Holographic Display and Services Market (by Product Type), Units, 2019-2025
Table 10.74: Argentina 3D Holographic Display Market (by Product Type), $Million, 2019-2025
Table 10.75: Argentina 3D Holographic Display and Services Market (by Product Type), Units, 2019-2025
Table 10.76: Rest-of-South America 3D Holographic Display Market (by Product Type), $Million, 2019-2025
Table 10.77: Rest-of-South America 3D Holographic Display Market (by Product Type), Units, 2019-2025
Table 11.1: KINO-MO LTD (HYPERVSN): Product Portfolio
Table 11.2: Fursol Corporation Ltd.: Product Portfolio
Table 11.3: Shenzhen Wiikk Technology Co., Ltd.: Product Portfolio
Table 11.4: Shenzhen Feitianxia Technology Ltd. (iDiskk): Product Portfolio
Table 11.5: Nanjing DSeeLab Digital Technology Co, Ltd: Product Portfolio
Table 11.6: Realfiction Holding AB: Product Portfolio
Table 11.7: Provision Holding, Inc: Product Portfolio
Table 11.8: MDH Hologram: Product Portfolio
Table 11.9: CPP Studios GmbH: Product Portfolio
Table 11.10: Looking Glass factory Inc: Product Portfolio
Table 11.11: Holoxica Ltd: Product Portfolio
Table 11.12: Holografika Kft: Product Portfolio
Table 11.13: LightSpace Technologies Inc.: Product Portfolio
Table 11.14: BAE Systems: Product Portfolio
Table 11.15: Envisics: Product Portfolio
Table 11.16: WayRay AG: Product Portfolio
Table 11.17: CY Vision: Product Portfolio
Table 11.18: Glimm International BV: Product Portfolio
Table 11.19: Shenzhen SMX Display Technology Co., LTD.: Product Portfolio
Table 11.20: Voxon Photonics.: Product Portfolio
Table 11.21: Holofil: Product Portfolio
Table 11.22: MAJIX.TECH: Product Portfolio
Table 11.23: HUDWAY: Product Portfolio
Table 11.24: Realview Imaging Ltd.: Product Portfolio
Table 11.25: DigiLens Inc.: Product Portfolio
Table 11.26: Burton Inc.: Product Portfolio
Table 11.27: HoloLamp: Product Portfolio
Table 11.28: Off The Wall Agency: Product Portfolio
Table 11.29: Leia Inc.: Product Portfolio
Table 11.30: Leia Inc.: Product Portfolio
Table 11.31: EXTEND3D GmbH: Product Portfolio
Table 11.32: Leia Display System: Product Portfolio
Table 11.33: HD FALCON: Product Portfolio
Table 11.34: Pixelo - 3D Holographic Display (Rivox): Product Portfolio
Table 11.35: HoPro: Product Portfolio
Table 11.36: HOLO Industries: Product Portfolio
Table 11.37: Fogio Inc: Product Portfolio
Table 11.38: HOLOBOX HOLOGRAPHY: Product Portfolio
Table 11.39: SuperbHolo: Product Portfolio
Table 11.40: VividQ: Product Portfolio
Table 11.41: Otoy: Product Portfolio
Table 11.42: Visby: Product Portfolio
Figure 1: Macroeconomic Trends Impacting Global 3D Holographic Display and Services Market Growth
Figure 2: Drivers and Restraints for Global 3D Holographic Display and Services Market
Figure 3: Global 3D Holographic Display and Services Market Snapshot
Figure 4: 3D Holographic Display and Services (by Product Type), 2020 and 2025
Figure 5: Global 3D Holographic Display and Services Market (by Application), $Million, 2020 and 2025
Figure 6: 3D Holographic Display and Services Market (by End Use Industry), $Million, 2020 and 2025
Figure 7: 3D Holographic Display and Services Market (by Business Model), $Million, 2020 and 2025
Figure 8: 3D Holographic Display and Services Market (by Value-Added Services), $Million, 2020 and 2025
Figure 9: Regional 3D Holographic Display and Services Market, $Million, 2019-2024
Figure 1.1: Market Dynamics and Impact Analysis
Figure 1.2: Value Chain Analysis
Figure 1.3: Parent Market for 3D Holographic Display and Services Market
Figure 2.1: Market Dynamics and Impact Analysis
Figure 2.2: Applications for 3D Holographic Display
Figure 3.1: Strategies Adopted by the Key Players (January 2017-August 2020)
Figure 3.2: Share of Key Market Strategies and Developments (January 2017-August 2020)
Figure 3.3: Partnerships, Collaborations, and Joint Ventures (by Company)
Figure 3.4: Product Launches and Development Landscape (by Company)
Figure 3.5: Business Expansion and Contract (by Company)
Figure 4.1: 3D Display Families
Figure 4.2: Global 3D Holographic Display: Investment and Funding, Jan 2017-Jul 2020
Figure 4.3: Investment and Funding Landscape Share (by Round), $Million
Figure 4.4: Investment and Funding Landscape Share (by Company), $Million
Figure 4.5: Year-Wise Patents Filed or Granted for 3D Holographic Displays January 2017-August 2020
Figure 4.6: Patent Analysis, (by Status), January 2017-August 2020
Figure 4.7: Patent Analysis (by Objective), January 2017-August 2020
Figure 4.8: Patent Analysis, (by Product Type), January 2017-August 2020
Figure 4.9: Patent Analysis, (by Application), January 2017-June 2020
Figure 4.10: Patent Analysis, (by Applicant Profile), January 2017-June 2020
Figure 4.11: Patent Analysis, (by Patent Office), January 2017-August 2020
Figure 5.1: 3D Holographic Display and Services Market for Content and Software Services, $Million, 2019-2025
Figure 5.2: 3D Holographic Display and Services Market for Support Services, $Million, 2019-2025
Figure 5.3: 3D Holographic Display and Services Market for Rental Services, $Million, 2019-2025
Figure 6.1: 3D Holographic Display and Services Market (for Spinning LED), $Million, 2019-2025
Figure 6.2: 3D Holographic Display and Services Market (for Spinning LED), Units, 2019-2025
Figure 6.3: 3D Holographic Display and Services Market (for Pseudo Holographic Display), $Million, 2019-2025
Figure 6.4: 3D Holographic Display and Services Market (for Pseudo Holographic Display), Units, 2019-2025
Figure 6.5: 3D Holographic Display and Services Market (for Planar and Television Type Display), $Million, 2019-2025
Figure 6.6: 3D Holographic Display and Services Market (for Planar and Television Type Display), Units, 2019-2025
Figure 6.7: 3D Holographic Display and Services Market (for HUDs), $Million, 2019-2025
Figure 6.8: 3D Holographic Display and Services Market (for HUDs), Units, 2019-2025
Figure 6.9: 3D Holographic Display and Services Market (for Volumetric Display), $Million, 2019-2025
Figure 6.10: 3D Holographic Display and Services Market (for Volumetric Display), Units, 2019-2025
Figure 7.1: Retail Application In 3D Holographic Display and Services Market, $Million, 2019-2025
Figure 7.2: Retail Application In 3D Holographic Display and Services Market, Units, 2019-2025
Figure 7.3: Trade Show, Conference, and Exhibition in 3D Holographic Display and Services Market, $Million, 2019-2025
Figure 7.4: Trade Show, Conference, and Exhibition Application in 3D Holographic Display and Services Market, Units, 2019-2025
Figure 7.5: Digital Signage Application in 3D Holographic Display and Services Market, $Million, 2019-2025
Figure 7.6: Digital Signage in 3D Holographic Display and Services Market, Units, 2019-2025
Figure 7.7: Navigation Application in 3D Holographic Display and Services Market, $Million, 2019-2025
Figure 7.8: Navigation in 3D Holographic Display and Services Market, Units, 2019-2025
Figure 7.9: Holographic Medical Imaging Application in 3D Holographic Display and Services Market, $Million, 2019-2025
Figure 7.10: Holographic Medical Imaging in 3D Holographic Display and Services Market, Units, 2019-2025
Figure 7.11: Others Application In 3D Holographic Display and Services Market, $Million, 2019-2025
Figure 7.12: Others In 3D Holographic Display and Services Market, Units, 2019-2025
Figure 8.1: 3D Holographic Display and Services Market (for Retail), $Million, 2019-2025
Figure 8.2: 3D Holographic Display and Services Market (for Retail), Units, 2019-2025
Figure 8.3: 3D Holographic Display and Services Market (for Media and Advertisement), $Million, 2019-2025
Figure 8.4: 3D Holographic Display and Services Market (for Media and Advertisement), Units, 2019-2025
Figure 8.5: 3D Holographic Display and Services Market (for Exhibition Industry), $Million, 2019-2025
Figure 8.6: 3D Holographic Display and Services Market (for Exhibition Industry), Units, 2019-2025
Figure 8.7: 3D Holographic Display and Services Market (for Automotive), $Million, 2019-2025
Figure 8.8: 3D Holographic Display and Services Market (for Automotive), Units, 2019-2020
Figure 8.9: 3D Holographic Display and Services Market (for Healthcare), $Million, 2019-2025
Figure 8.10: 3D Holographic Display and Services Market (for Healthcare), Units, 2019-2025
Figure 8.11: 3D Holographic Display and Services Market (for Defense & Aerospace and Aviation), $Million, 2019-2025
Figure 8.12: 3D Holographic Display and Services Market (for Defense & Aerospace and Aviation), Units, 2019-2025
Figure 8.13: 3D Holographic Display and Services Market (for Consumer Electronics), $Million, 2019-2025
Figure 8.14: 3D Holographic Display and Services Market (for Consumer Electronics), Units, 2019-2025
Figure 8.15: 3D Holographic Display and Services Market (for Others), $Million, 2019-2025
Figure 8.16: 3D Holographic Display and Services Market (for Others), Units, 2019-2025a
Figure 9.1: Value Chain for Display-as-a-Product Business Model
Figure 9.2: 3D Holographic Display and Services Market for Display-as-a-Product, $Million, 2019-2025
Figure 9.3: 3D Holographic Display and Services Market (for Display-as-a-Product), Units, 2019-2025
Figure 9.4: Advantages of Display-as-a-Service Business Model
Figure 9.5: Value Chain for Display-as-a-Service Business Model
Figure 9.6: 3D Holographic Display and Services Market (for Display-as-a-Service), $Million, 2019-2025
Figure 9.7: 3D Holographic Display and Services Market (for Display-as-a-Service), Units, 2019-2025
Figure 10.1: North America 3D Holographic Display and Services Market, $Million, 2019-2025
Figure 10.2: North America 3D Holographic Display and Services Market, Units, 2019-2025
Figure 10.3: Europe 3D Holographic Display and Services Market, $Million, 2019-2025
Figure 10.4: Europe 3D Holographic Display and Services Market, Units, 2019-2025
Figure 10.5: U.K. 3D Holographic Display and Services Market, $Million, 2019-2025
Figure 10.6: U.K. 3D Holographic Display and Services Market, Units, 2019-2025
Figure 10.7: Asia-Pacific and Japan 3D Holographic Display and Services Market, $Million, 2019-2025
Figure 10.8: Asia-Pacific and Japan 3D Holographic Display and Services Market, Units, 2019-2025
Figure 10.9: China 3D Holographic Display and Services Market, $Million, 2019-2025
Figure 10.10: China 3D Holographic Display and Services Market, Units, 2019-2025
Figure 10.11: Middle East and Africa 3D Holographic Display and Services Market, $Million, 2019-2025
Figure 10.12: Middle East and Africa 3D Holographic Display and Services Market, Units, 2019-2025
Figure 10.13: South America 3D Holographic Display and Services Market, $Million, 2019-2025
Figure 10.14: South America 3D Holographic Display and Services Market, Units, 2019-2025
Figure 11.1: Share of Key Companies
Figure 11.2: KINO-MO LTD (HYPERVSN): SWOT Analysis
Figure 11.3: FURSOL CORPORATION LTD.: SWOT Analysis
Figure 11.4: Shenzhen Wiikk Technology Co., Ltd.: SWOT Analysis
Figure 11.5: Shenzhen Feitianxia Technology Ltd. (iDiskk): SWOT Analysis
Figure 11.6: Nanjing DSeeLab Digital Technology Co, Ltd: SWOT Analysis
Figure 11.7: Realfiction Holding AB: Overall Financials, 2017-2019
Figure 11.8: Realfiction Holding AB: SWOT Analysis
Figure 11.9: Provision Holding, Inc.: Overall Financials, 2016-2018
Figure 11.10: Provision Holding, Inc.: Net Revenue by Business Segment, 2016-2018
Figure 11.11: Provision Holding, Inc. LTD: SWOT Analysis
Figure 11.12: MDH Hologram: SWOT Analysis
Figure 11.13: CPP Studios GmbH: SWOT Analysis
Figure 11.14: Looking Glass factory Inc: SWOT Analysis
Figure 11.15: Holoxica Ltd: SWOT Analysis
Figure 11.16: Holografika Kft: SWOT Analysis
Figure 11.17: LightSpace Technologies Inc.: SWOT Analysis
Figure 11.18: BAE System: Overall Financials, 2016-2018
Figure 11.19: BAE System: Net Revenue by Business Segment, 2016-2018
Figure 11.20: BAE System: Net Revenue by Regional Segment, 2016-2018
Figure 11.21: BAE Systems: SWOT Analysis
Figure 11.22: Envisics: SWOT Analysis
Figure 11.23: WayRay AG: SWOT Analysis
Figure 11.24: CY Vision: SWOT Analysis
Figure 11.25: Glimm International BV: SWOT Analysis
Figure 11.26: Shenzhen SMX Display Technology Co., LTD: SWOT Analysis
Figure 12.1: 3D Holographic Display and Services Market Scope
Figure 12.2: Report Methodology
Figure 12.3: Primary Interviews Breakdown, by Player, Designation, and Region
Figure 12.4: Sources of Secondary Research
Figure 12.5: Data Triangulation
Figure 12.6: Top Down-Bottom-Up Approach for Market Estimation
Report Description
Market Report Coverage - Global 3D Holographic Display and Services Market |
|||
Base Year |
2019 |
Market Size in 2020 |
$607.6 Million |
Forecast Period |
2020-2025 |
Value Projection and Estimation by 2025 |
$1,837.1 Million |
CAGR During Forecast Period |
24.8% |
Number of Tables |
154 |
Number of Pages |
330 |
Number of Figures |
124 |
Research Hours |
1420 |
|
|
Market Segmentation |
• Product Type – Spinning LED, Pseudo Holographic displays, Planar and Television type display, Heads-Up Display, Volumetric Display • Applications – Retail, Trade shows & Conferences, Digital Signage, Navigational Display, Medical Imaging, Others • End-Use Industries – Retail, Media & Advertisement, Exhibition Industry, Automotive, Medical & Healthcare, Defense & Aerospace and Aviation, Consumer Electronics, Others • Business Model – Display as a product, Display as a Service • Value Added Services - Content and Software, Integration and Deployment, Rental Services • Region – North America, South America, Europe, U.K., China, Asia-Pacific Japan, and Middle East and Africa |
||
Regional Segmentation |
• North America – U.S., Canada, Mexico • South America – Brazil, Argentina, and Rest-of-South America • Europe –Germany, Netherlands, Belgium, Sweden, France, Switzerland, and Rest-of-Europe • U.K. • China • Asia-Pacific and Japan – Japan, South Korea, India, Australia and New Zealand, Taiwan, and Rest-of-Asia-Pacific and Japan • Middle East Africa –U.A.E., Israel, and Rest-of-Middle East and Africa |
||
Market Growth Drivers |
• Increased Demand for 3D Holographic Displays Creative Economy • Growing Adoption of Medical Imaging in the Healthcare Industry • Rising Industrial Automation with Industry 4.0 Applications |
||
Market Growth Restraints |
• High Manufacturing Cost of Display Technologies • Presence of Other Alternatives to Holographic Displays and Low Adoption Rate • Less Effective Projection Under Sunlight |
||
Market Opportunities |
• Rapidly Advancing Smartphone and Tablet Market • 5G and 6G Communication Technologies |
||
Key 3D Holographic Display Companies Profiled |
Realfiction Holdings AB, Fursol Corporation Ltd., Holoxica, MDH Hologram Ltd, Looking Glass Factory Inc., Provision Holding Inc., Kino-mo Limited (HYPERVSN), Shenzhen SMX, Display Technology Co. Ltd, Glimm Display, Nanjing DSeeLab Digital Technology Co.,Ltd., CPP Studios GMBH, Shenzhen Wiikk Technology Co., Ltd., Holografika, Envisics, CY Vision, WayRay, BAE Systems, Voxon Photonics, Lightspace Technologies., Shenzhen Feitianxia Technology Ltd. (iDiskk) , HUDWAY, LLC, DigiLens Inc., SeeReal Technologies S.A., Leia Inc., Light Field Lab, Inc. |
Key Questions Answered in this Report:
• What is the expected global 3D holographic display and services market size in terms of value and volume during the forecast period, 2019-2025?
• What is the expected future scenario and revenue generated by the different product types, different applications, and different end-use industries, business models and services?
• What is the expected future scenario and revenue generated by different product types?
• What is the expected future scenario and revenue generated by the application segments for which 3D holographic display and services are offered, including retail, trade shows & conferences, digital signage, navigation, and medical imaging others?
• Which region is the largest market for the global 3D holographic display and services market?
• What is the expected future scenario and the revenue generated by different regions and countries in the 3D holographic display and services market, such as North America, Europe, Asia-Pacific & Japan, China, U.K., South America, and Middles-East and Africa?
• What is the competitive strength of the key players in the 3D holographic display and services market on the basis of the analysis of their recent developments, product offerings, and regional presence?
• Where do the key 3D holographic display and services companies lie in their competitive benchmarking compared to the factors of market coverage and market potential?
• How are the adoption scenario, related opportunities, and challenges impacting the 3D holographic display and services markets?
• What will be the impact of COVID-19 on the market size, market forecast, CAGR, and market dynamics of the global 3D holographic display and services market across different market segmentations?
• How is the funding and investment landscape in the global 3D holographic display and services market?
• Which are the leading consortiums and associations in the global 3D holographic display, and services market, and what is their role in the market?
• What are the market dynamics of the global 3D holographic display and services market and what is their role in the market, including market drivers, restraints, and opportunities?
• What is the SWOT Analysis for leading companies in the 3D holographic display and services market?
Market Overview
Market Size, Forecast, and Analysis
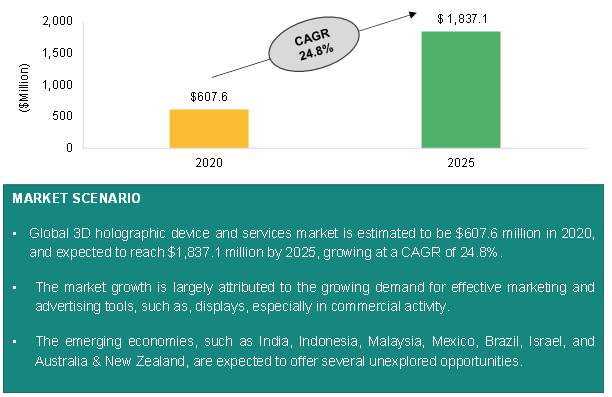
Figure: Global 3D Holographic Display and Services Market Snapshot
Source: Expert Interviews and BIS Research Analysis
The global 3D holographic display and services market is projected to grow from $607.6 million in 2020 to $1,837.1 million by 2025, at a CAGR of 24.8%. The growth in the 3D holographic display and services market is expected to be driven by the continuous efforts to modernize the advertisement and media industry. Additionally, the growth of the retail industry is further pushing the demand for more advanced technologies in marketing and merchandising strategies.
Moreover, Industry 4.0 technologies such as computer vision and digital twin are display-dependent technologies which are creating more market opportunities. The idea to enable display devices with AR and holographic capabilities will enhance the operability and efficiency for computer vision, digital twin, and any related display dependent technology. Hence, this can be obtained with 3D holographic display systems in place, thereby expecting its significant growth during the forecast period 2020-2025.
The 3D holographic display and services technology has gained adoption in various business industries such as retail, media & advertisement, exhibition industry, automotive, medical & healthcare, defense & aerospace and aviation, consumer electronics, either to add value or increase operational productivity. The commercial industries, such as retail, media & advertisement, and exhibition industry, have very high consumer interaction. 3D holographic displays are well-equipped with features to enhance the overall experience of the consumers. This has the potential to increase consumer engagement and change customer behavior, and ultimately increase brand awareness and reach.
The automotive industry is moving toward producing completely autonomous vehicles. However, the industry needs to start implementing the existing technologies to increase the autonomy of currently available vehicles. Heads-up-displays enabled with AR holographic capabilities shall enhance vehicle autonomy and decrease the risks of potential accidents, as drivers do not have to look away from the usual viewpoint. These products are being deployed either as a stand-alone unit or being integrated along with the vehicle during production. Either way, heads-up-displays are going to disrupt the whole automotive industry and will further add to the 3D holographic display market.
The healthcare industry is one of the crucial and essential industries supporting the economy as well sustaining human life. Medical imaging application associated with the healthcare industry is a highly sought-after application for a 3D holographic display. 3D holographic displays can display 3D holographic content, which allows to visualizing human anatomy at a 3D level, which can be viewed from various angles, allowing practitioners and users to point the exact location for any disease or problem in real-time. The 2D options require to compile pictures from various angles. This application is expected to have a significant impact on the 3D holographic display market.
Impact of COVID-19 on Global 3D Holographic Display and Services Market
The 3D holographic display and services market is expected to experience continuous growth, owing to the increasing demand from retail and commercial industries. However, in 2020, the 3D holographic display and services market is expected to experience a downfall due to the COVID-19 pandemic, as the assembling and the installation of the 3D holographic display have been reduced. The current period has affected the supply chain and logistics, which has indirectly affected the demand for 3D holographic displays. The lockdown procedures additionally have reduced the number of people going to retail stores, and thus any effort to customer engagement has reduced. Thus, retailers are currently only focusing on replenishing stocks and maintaining sales. With the lockdown being imposed in most parts of the world during the first two quarters of 2020, there has been a scarcity of resources worldwide in terms of availability of skilled workforce and the supply of hardware equipment for manufacturing, which is expected to impact the global 3D holographic display and services market for this particular year. The growth of the 3D holographic display and services market is expected to revive sparsely in Q4 2020 once the operational activities become normal post lockdown.
Competitive Landscape
The competitive landscape for the 3D holographic display and services market demonstrates an inclination toward companies adopting strategies such as product launch and development and partnerships, collaborations, and joint ventures. Key players in the market are focusing on product launches and developments to introduce new technologies or developing further on the existing product portfolio. The market is highly fragmented and sparsely distributed with the presence of many small- to medium-sized companies that compete with each other. To generate public awareness about their existing and new products and technologies and compete with the competitors’ product portfolio, key players operating in this market have ramped up their product launch activities over the recent years. Product launch has been one of the most widely adopted strategies by the players in this market. For instance, in 2020, Holografika, along with Temicon GMBH, launched a new product line called 3D LED wall. Similarly, in November 2019, Hypervsn launched a new feature to its existing cloud-based software. The feature allows to track health on various parameters, for instance, temperature.
The partnership and collaboration strategy has been significantly employed for expansion by key players in the 3D holographic display and services market. With the increasing growth in the global market, companies operating in this industry are compelled to come up with collaborative strategies to sustain in the highly competitive market. In February 2020, Realfiction entered into an agreement with EDEKA that will open for testing the magic-as-a-service offering in 25 EDEKA stores in the Niedersachsen and Nordrhein-Westfalen regions in Germany. Similarly, in March 2020, HYPERVSN and KNM Eesti partnered to transform advertising in Baltic States and increase the market for spinning LEDs in advertisement, retail, and promotions.
Regional Market Dynamics
The 3D holographic display and services market holds a prominent share in various countries of North America, Europe, Asia-Pacific and Japan, and the Middle East and Africa. North America is estimated to generate the highest revenue in 2020. The large market share of the region has been attributed to the higher adoption of spinning LED and pseudo holographic display devices in commercial and retail applications. These devices can increase product reach and brand awareness. Europe is estimated to generate the second-highest revenue in 2020. This is attributed to the large number of manufacturers offering their products in the region as well as many retailers. Both these regions have a well-developed retail infrastructure, with a majority of the population depended on retail for daily supplies as well as other useful products. Thus, the 3D holographic display and services market is expected to flourish and grow rapidly in the regions of North America and Europe.
Asia-Pacific and Japan, in 2019, held a smaller market share as compared to North America and Europe. The market is highly cost-sensitive and has a high penetration of conventional display technology. However, Asia-Pacific and Japan is expected to showcase the fastest market growth, i.e., a CAGR of 24.9% from 2020 to 2025.
Global 3D Holographic Display and Services Market
Focus on Product (Pseudo Holographic, Spinning LED, Planar and Television, Head-up Display, Volumetric), Application, Industry (Retail, Exhibition, Automotive, Healthcare, Defense, Aerospace, Consumer Elec.), Business Models, Patents, Funding, Technology, Impact of COVID-19 - Analysis and Forecast (2020-2025)