A quick peek into the report
Table of Contents
2.1 Overview: Report Scope
2.2 Segmentation of the Global Electronic Skin Patches Market
2.3 Assumptions and Limitations
2.4 Key Questions Answered in the Report
2.5 Base Year and Forecast Period
3.1 Overview: Research Methodology
3.2 Primary Data Sources
3.3 Secondary Data Sources
3.4 Market Estimation Method
3.4.1 Data and Prediction Modeling
3.4.2 Top-Down and Bottom-Up Approach
3.5 Validation of the Market Estimates and Projections
3.6 Industry Participants
3.7 Assumptions and Limitations
4.1 Regulatory Scenario
4.1.1 Legal Requirements and Regulations
4.1.1.1 Regulations in the U.S.
4.1.1.2 Regulations in Europe
4.1.1.3 Regulations in Other Countries
4.2 Patent Analysis
5.1 Overview
5.2 Key Strategies and Developments (2016-2019)
5.2.1 Joint Venture, Agreement, Collaborations, and Partnerships
5.2.2 Product Launches, Approvals, Licenses, and Clearances
5.2.3 Mergers and Acquisitions
5.2.4 Business Expansion
5.3 Market Share Analysis of Global Electronic Skin Patches Market (by Company), 2018
5.4 Growth Share Analysis
5.5 Product Mapping Analysis
6.1 Assumptions and Limitations
6.2 Global Market Scenario
6.3 Market Dynamics
6.3.1 Overview
6.3.2 Impact Analysis
6.3.3 Market Drivers
6.3.3.1 Growing Geriatric Population Leads to Surge in Exigency of Electronic Skin Patches
6.3.3.2 Increasing Burden of Chronic and Lifestyle-Associated Diseases Elevating the Requirement of Continuous Monitoring and Treatment of a Disease
6.3.3.2.1 Increase in Prevalence of Diabetic Population
6.3.3.2.2 Increase in Prevalence of Cardiovascular Diseases
6.3.3.2.3 Surge in Number of Obese Individuals
6.3.3.3 Increasing Inclination for Personal Health and Fitness Amongst the Population
6.3.3.4 Increasing Healthcare Expenditure
6.3.3.5 Growing Prominence for Point-of-Care Technologies
6.3.3.6 Increasing Penetration of Mobile Platforms, Tablets, and Smartphones
6.3.4 Market Restraints
6.3.4.1 High Initial Cost and Design Complexity of Electronic Skin Patches Impeding the Growth in the Market
6.3.4.2 Lack of Data Security and Lack of Interoperability are Limiting the Adoption of Electronic Skin Patches
6.3.5 Market Opportunities
6.3.5.1 Untapped Market in Developing Economies
6.3.5.2 Scope for More Technologically Advanced Electronic Skin Patches
6.3.6 Market Trends
6.3.6.1 Increasing Adoption of Cloud Technology in Healthcare
7.1 Overview
7.2 Monitoring and Diagnostic Electronic Skin Patches
7.3 Therapeutic Electronic Skin Patches
8.1 Overview
8.2 Diabetes Management
8.3 Cardiovascular Management and Temperature Monitoring
8.4 Pain Management
8.5 Others
9.1 Overview
9.2 North America
9.2.1 North America Electronic Skin Patches Market (by Type)
9.2.2 North America Electronic Skin Patches Market (by Application)
9.2.3 North America Electronic Skin Patches Market (by Country)
9.2.3.1 U.S.
9.2.3.1.1 U.S. Electronic Skin Patches Market (by Type)
9.2.3.1.2 U.S. Electronic Skin Patches Market (by Application)
9.2.3.2 Canada
9.2.3.2.1 Canada Electronic Skin Patches Market (by Type)
9.2.3.2.2 Canada Electronic Skin Patches Market (by Application)
9.3 Europe
9.3.1 Europe Electronic Skin Patches Market (by Type)
9.3.2 Europe Electronic Skin Patches Market (by Application)
9.3.3 Europe Electronic Skin Patches Market (by Country)
9.3.3.1 Germany
9.3.3.1.1 Germany Electronic Skin Patches Market (by Type)
9.3.3.1.2 Germany Electronic Skin Patches Market (by Application)
9.3.3.2 U.K.
9.3.3.2.1 U.K. Electronic Skin Patches Market (by Type)
9.3.3.2.2 U.K. Electronic Skin Patches Market (by Application)
9.3.3.3 France
9.3.3.3.1 France Electronic Skin Patches Market (by Type)
9.3.3.3.2 France Electronic Skin Patches Market (by Application)
9.3.3.4 Italy
9.3.3.4.1 Italy Electronic Skin Patches Market (by Type)
9.3.3.4.2 Italy Electronic Skin Patches Market (by Application)
9.3.3.5 Spain
9.3.3.5.1 Spain Electronic Skin Patches Market (by Type)
9.3.3.5.2 Spain Electronic Skin Patches Market (by Application)
9.3.3.6 Rest-of-Europe
9.3.3.6.1 Rest-of-Europe Electronic Skin Patches Market (by Type)
9.3.3.6.2 Rest-of-Europe Electronic Skin Patches Market (by Application)
9.4 Asia-Pacific
9.4.1 Asia-Pacific Electronic Skin Patches Market (by Type)
9.4.2 Asia-Pacific Electronic Skin Patches Market (by Application)
9.4.3 Asia-Pacific Electronic Skin Patches Market (by Country)
9.4.3.1 Japan
9.4.3.1.1 Japan Electronic Skin Patches Market (by Type)
9.4.3.1.2 Japan Electronic Skin Patches Market (by Application)
9.4.3.2 China
9.4.3.2.1 China Electronic Skin Patches Market (by Type)
9.4.3.2.2 China Electronic Skin Patches Market (by Application)
9.4.3.3 India
9.4.3.3.1 India Electronic Skin Patches Market (by Type)
9.4.3.3.2 India Electronic Skin Patches Market (by Application)
9.4.3.4 South Korea
9.4.3.4.1 South Korea Electronic Skin Patches Market (by Type)
9.4.3.4.2 South Korea Electronic Skin Patches Market (by Application)
9.4.3.5 Australia
9.4.3.5.1 Australia Electronic Skin Patches Market (by Type)
9.4.3.5.2 Australia Electronic Skin Patches Market (by Application)
9.4.3.6 Rest-of-Asia-Pacific
9.4.3.6.1 Rest-of-Asia-Pacific Electronic Skin Patches Market (by Type)
9.4.3.6.2 Rest-of-Asia-Pacific Electronic Skin Patches Market (by Application)
9.5 Latin America
9.5.1 Latin America Electronic Skin Patches Market (by Type)
9.5.2 Latin America Electronic Skin Patches Market (by Application)
9.5.3 Latin America Electronic Skin Patches Market (by Country)
9.5.3.1 Brazil
9.5.3.1.1 Brazil Electronic Skin Patches Market (by Type)
9.5.3.1.2 Brazil Electronic Skin Patches Market (by Application)
9.5.3.2 Mexico
9.5.3.2.1 Mexico Electronic Skin Patches Market (by Type)
9.5.3.2.2 Mexico Electronic Skin Patches Market (by Application)
9.5.3.3 Rest-of-Latin America
9.5.3.3.1 Rest-of-Latin America Electronic Skin Patches Market (by Type)
9.5.3.3.2 Rest-of-Latin America Electronic Skin Patches Market (by Application)
9.6 Middle East and Africa
9.6.1 Middle East and Africa Electronic Skin Patches Market (by Type)
9.6.2 Middle East and Africa Electronic Skin Patches Market (by Application)
10.1 Abbott Laboratories
10.1.1 Company Overview
10.1.2 Role of Abbott Laboratories in the Electronic Skin Patches Market
10.1.3 Financials
10.1.4 SWOT Analysis
10.2 BioTelemetry, Inc.
10.2.1 Company Overview
10.2.2 Role of BioTelemetry, Inc. in the Electronic Skin Patches Market
10.2.3 Financials
10.2.4 SWOT Analysis
10.3 DexCom, Inc.
10.3.1 Company Overview
10.3.2 Role of DexCom, Inc. in the Electronic Skin Patches Market
10.3.3 Financials
10.3.4 SWOT Analysis
10.4 General Electric Company
10.4.1 Company Overview
10.4.2 Role of General Electric Company in the Electronic Skin Patches Market
10.4.3 Financials
10.4.4 SWOT Analysis
10.5 Insulet Corporation
10.5.1 Company Overview
10.5.2 Role of Insulet Corporation in the Electronic Skin Patches Market
10.5.3 Financials
10.5.4 SWOT Analysis
10.6 iRhythm Technologies, Inc.
10.6.1 Company Overview
10.6.2 Role of iRhythm Technologies, Inc. in the Electronic Skin Patches Market
10.6.3 Financials
10.6.4 SWOT Analysis
10.7 Koninklijke Philips N.V.
10.7.1 Company Overview
10.7.2 Role of Koninklijke Philips N.V. in the Global Electronic Skin Patches Market
10.7.3 Financials
10.7.4 SWOT Analysis
10.8 LifeSignals
10.8.1 Company Overview
10.8.2 Role of LifeSignals in the Electronic Skin Patches Market
10.8.3 SWOT Analysis
10.9 Medtronic, Plc.
10.9.1 Company Overview
10.9.2 Role of Medtronic Plc in the Electronic Skin Patches Market
10.9.3 Financials
10.9.4 SWOT Analysis
10.10 MC10, Inc.
10.10.1 Company Overview
10.10.2 Role of MC10, Inc. in the Electronic Skin Patches Market
10.10.3 SWOT Analysis
10.11 Nemaura Medical Inc.
10.11.1 Company Overview
10.11.2 Role of Nemaura Medical, Inc. in the Electronic Skin Patches Market
10.11.3 Financials
10.11.4 SWOT Analysis
10.12 Omron Corporation
10.12.1 Company Overview
10.12.2 Role of Omron Corporation in the Global Electronic Skin Patches Market
10.12.3 Financials
10.12.4 SWOT Analysis
10.13 Senseonics Holding, Inc.
10.13.1 Company Overview
10.13.2 Role of Senseonics Holdings, Inc. in the Electronic Skin Patches Market
10.13.3 Financials
10.13.4 SWOT Analysis
10.14 VivaLNK
10.14.1 Company Overview
10.14.2 Role of VivaLNK in the Electronic Skin Patches Market
10.14.3 SWOT Analysis
10.15 VitalConnect
10.15.1 Company Overview
10.15.2 Role of VitalConnect in the Electronic Skin Patches Market
10.15.3 SWOT Analysis
Table 4.1: Regulatory Authority/ Association/ Consortium of the Global Electronic Skin Patches Market
Table 6.1: Percentage of Prevalence of Obesity among Adults in Different Countries, 2010, 2013, and 2016
Table 9.1: Prevalence of Diseases in North America, 2014-2017
Table 9.2: Prevalence of Diseases in the U.S., 2014-2017
Table 9.3: Statistics of Diabetes in Canada
Table 9.4: Prevalence of Diseases in Canada, 2014-2017
Table 9.5: Prevalence of Diseases in Europe, 2014-2017
Table 9.6: Prevalence of Diseases in Germany, 2014-2017
Table 9.7: Prevalence of Diseases in U.K., 2014-2017
Table 9.8: Prevalence of Diseases in France, 2014-2017
Table 9.9: Prevalence of Diseases in Italy, 2014-2017
Table 9.10: Prevalence of Diseases in Spain, 2014-2017
Table 9.11: Prevalence of Diseases in Asia, 2014-2017
Table 9.12: Prevalence of Diseases in Japan, 2014-2017
Table 9.13: Prevalence of Diseases in China, 2014-2017
Table 9.14: Prevalence of Diseases in India, 2014-2017
Table 9.15: Prevalence of Diseases in South Korea, 2014-2017
Table 9.16: Prevalence of Diseases in Australia, 2014-2017
Table 9.17: Prevalence of Diseases in Latin America and the Caribbean, 2014-2017
Table 9.18: Prevalence of Diseases in Brazil, 2014-2017
Table 9.19: Prevalence of Diseases in Mexico, 2014-2017
Table 9.20: Prevalence of Diseases in Argentina, 2014-2017
Table 9.21: Prevalence of Diseases in Middle East and North Africa, 2014-2017
Figure 1: Global Electronic Skin Patches Market Snapshot
Figure 2: Global Electronic Skin Patches Market, 2018-2024
Figure 3: Market Drivers and Market Restraints
Figure 4: Competitive Scenario of Global Electronic Skin Patches Market, 2018
Figure 5: Strategic Developments in the Global Electronic Skin Patches Market, January 2016-October 2019
Figure 6: Global Electronic Skin Patches Market (by Type), 2018 and 2024
Figure 7: Growth Share Matrix of Global Electronic Skin Patches (by Application), 2018
Figure 8: Competitive Benchmarking by Application
Figure 9: Global Electronic Skin Patches Market Scenario, 2018 to 2024
Figure 1.1: Types of Skin Patches
Figure 1.2: Benefits of Electronic Skin Patches
Figure 2.1: Global Electronic Skin Patches: Market Segmentation
Figure 3.1: Electronic Skin Patches Market Research Methodology
Figure 3.2: Primary Research
Figure 3.3: Secondary Research
Figure 3.4: Considered Factors for Data Prediction and Modeling
Figure 3.5: Top-Down Approach (Segment-Wise Analysis)
Figure 3.6: Bottom-Up Approach (Segment-Wise Analysis)
Figure 3.7: Data Triangulation
Figure 3.8: Total Number of Companies Profiles
Figure 3.9: Assumptions and Limitations
Figure 4.1: Share of Patent by Ownership, January 2016-October 2019
Figure 5.1: Competitive Landscape
Figure 5.2: Share of Key Developments and Strategies- January 2016-October 2019
Figure 5.3: Agreements, Collaborations, Joint Ventures, and Partnership (by Company), January 2016-October 2019
Figure 5.4: Product Launches, Approvals, Licenses, and Clearances (by Company), January 2016-October 2019
Figure 5.5: Mergers and Acquisitions (by Company), January 2016–October 2019
Figure 5.6: Business Expansion (by Company), January 2016-October 2019
Figure 5.7: Market Share Analysis of Global Electronic Skin Patches (by Company), 2018
Figure 5.8: Growth Share Matrix for Global Electronic Skin Patches Market (by Application), 2018
Figure 5.9: Competitive Benchmarking by Application
Figure 6.1: Segmentation of Electronic Skin Patches
Figure 6.2: Global Electronic Skin Patches Market, 2018-2024
Figure 6.3: Drivers, Restraints, and Opportunities of the Global Electronic Skin Patches Market
Figure 6.4: Impact Analysis
Figure 6.5: Geriatric Population (60 years and above) Worldwide in Different Regions, 2000, 2015, 2030, and 2050
Figure 6.6: Number of People with Diabetes in 2017 and 2045 (20-79 years)
Figure 6.7: Percentage of Young Adults with Diabetes Developing Complications from the Disease
Figure 6.8: Statistics of Self-Tracking Health Data in the U.S.
Figure 6.9: Percentage of Young Adults Using Smartphones and Older Population Grabbing Smartphones in Different Countries
Figure 6.10: Benefits of Cloud Computing in Healthcare
Figure 7.1: Segmentation of Electronic Skin Patches Market (by Type)
Figure 7.2: Global Electronic Skin Patches Market (by Type), Market Share in 2018
Figure 7.3: Global Monitoring and Diagnostic Electronic Skin Patches Market, 2018-2024
Figure 7.4: Global Therapeutic Electronic Skin Patches Market, 2018-2024
Figure 8.1: Segmentation of Electronic Skin Patches Market (by Application)
Figure 8.2: Global Electronic Skin Patches Market (by Application), 2018 and 2024
Figure 8.3: Global Diabetes Management Market by Electronic Skin Patches, 2018-2024
Figure 8.4: Global Cardiovascular Management and Temperature Monitoring Market by Electronic Skin Patches, 2018-2024
Figure 8.5: Global Pain Management Market by Electronic Skin Patches, 2018-2024
Figure 8.6: Global Other Electronic Skin Patches Market, 2018-2024
Figure 9.1: Global Electronic Skin Patches Market Scenario, 2018 to 2024
Figure 9.2: North America Electronic Skin Patches Market, 2018-2024
Figure 9.3: North America: Market Dynamics
Figure 9.4: North America Electronic Skin Patches Market (by Type), 2018-2024
Figure 9.5: North America Electronic Skin Patches Market (by Application), 2018-2024
Figure 9.6: North America Electronic Skin Patches Market (by Country), 2018 and 2024
Figure 9.7: U.S. Electronic Skin Patches Market, 2018-2024
Figure 9.8: U.S. Electronic Skin Patches Market (by Type), 2018-2024
Figure 9.9: U.S. Electronic Skin Patches Market (by Application), 2018-2024
Figure 9.10: Canada Electronic Skin Patches Market, 2018-2024
Figure 9.11: Canada Electronic Skin Patches Market (by Type), 2018-2024
Figure 9.12: Canada Electronic Skin Patches Market (by Application), 2018-2024
Figure 9.13: Europe Electronic Skin Patches Market, 2018-2024
Figure 9.14: Europe: Market Dynamics
Figure 9.15: Europe Electronic Skin Patches Market (by Type), 2018-2024
Figure 9.16: Europe Electronic Skin Patches Market (by Application), 2018-2024
Figure 9.17: Europe Electronic Skin Patches Market (by Country), 2018 and 2024
Figure 9.18: Germany Electronic Skin Patches Market, 2018-2024
Figure 9.19: Germany Electronic Skin Patches Market (by Type), 2018-2024
Figure 9.20: Germany Electronic Skin Patches Market (by Application), 2018-2024
Figure 9.21: U.K. Electronic Skin Patches Market, 2018-2024
Figure 9.22: U.K. Electronic Skin Patches Market (by Type), 2018-2024
Figure 9.23: U.K. Electronic Skin Patches Market (by Application), 2018-2024
Figure 9.24: Percentage of Total Deaths in France, in 2016
Figure 9.25: France Electronic Skin Patches Market, 2018-2024
Figure 9.26: France Electronic Skin Patches Market (by Type), 2018-2024
Figure 9.27: France Electronic Skin Patches Market (by Application), 2018-2024
Figure 9.28: Italy Electronic Skin Patches Market, 2018-2024
Figure 9.29: Italy Electronic Skin Patches Market (by Type), 2018-2024
Figure 9.30: Italy Electronic Skin Patches Market (by Application), 2018-2024
Figure 9.31: Spain Electronic Skin Patches Market, 2018-2024
Figure 9.32: Spain Electronic Skin Patches Market (by Type), 2018-2024
Figure 9.33: Spain Electronic Skin Patches Market (by Application), 2018-2024
Figure 9.34: Rest-of-Europe Electronic Skin Patches Market, 2018-2024
Figure 9.35: Rest-of-Europe Electronic Skin Patches Market (by Type), 2018-2024
Figure 9.36: Rest-of-Europe Electronic Skin Patches Market (by Application), 2018-2024
Figure 9.37: Asia-Pacific Electronic Skin Patches Market, 2018-2024
Figure 9.38: Asia-Pacific: Market Dynamics
Figure 9.39: Asia-Pacific Electronic Skin Patches Market (by Type), 2018-2024
Figure 9.40: Asia-Pacific Electronic Skin Patches Market (by Application), 2018-2024
Figure 9.41: Asia-Pacific Electronic Skin Patches Market (by Country), 2018 and 2024
Figure 9.42: Japan Electronic Skin Patches Market, 2018-2024
Figure 9.43: Japan Electronic Skin Patches Market (by Type), 2018-2024
Figure 9.44: Japan Electronic Skin Patches Market (by Application), 2018-2024
Figure 9.45: China Electronic Skin Patches Market, 2018-2024
Figure 9.46: China Electronic Skin Patches Market (by Type), 2018-2024
Figure 9.47: China Electronic Skin Patches Market (by Application), 2018-2024
Figure 9.48: India Electronic Skin Patches Market, 2018-2024
Figure 9.49: India Electronic Skin Patches Market (by Type), 2018-2024
Figure 9.50: India Electronic Skin Patches Market (by Application), 2018-2024
Figure 9.51: South Korea Electronic Skin Patches Market, 2018-2024
Figure 9.52: South Korea Electronic Skin Patches Market (by Type), 2018-2024
Figure 9.53: South Korea Electronic Skin Patches Market (by Application), 2018-2024
Figure 9.54: Australia Electronic Skin Patches Market, 2018-2024
Figure 9.55: Australia Electronic Skin Patches Market (by Type), 2018-2024
Figure 9.56: Australia Electronic Skin Patches Market (by Application), 2018-2024
Figure 9.57: Rest-of-Asia-Pacific Electronic Skin Patches Market, 2018-2024
Figure 9.58: Rest-of-Asia-Pacific Electronic Skin Patches Market (by Type), 2018-2024
Figure 9.59: Rest-of-Asia-Pacific Electronic Skin Patches Market (by Application), 2018-2024
Figure 9.60: Latin America Electronic Skin Patches Market, 2018-2024
Figure 9.61: Latin America: Market Dynamics
Figure 9.62: Latin America Electronic Skin Patches Market (by Type), 2018-2024
Figure 9.63: Latin America Electronic Skin Patches Market (by Application), 2018-2024
Figure 9.64: Latin America Electronic Skin Patches Market (by Country), 2018 and 2024
Figure 9.65: Brazil Electronic Skin Patches Market, 2018-2024
Figure 9.66: Brazil Electronic Skin Patches Market (by Type), 2018-2024
Figure 9.67: Brazil Electronic Skin Patches Market (by Application), 2018-2024
Figure 9.68: Mexico Electronic Skin Patches Market, 2018-2024
Figure 9.69: Mexico Electronic Skin Patches Market (by Type), 2018-2024
Figure 9.70: Mexico Electronic Skin Patches Market (by Application), 2018-2024
Figure 9.71: Rest-of-Latin America Electronic Skin Patches Market, 2018-2024
Figure 9.72: Rest-of-Latin America Electronic Skin Patches Market (by Type), 2018-2024
Figure 9.73: Rest-of-Latin America Electronic Skin Patches Market (by Application), 2018-2024
Figure 9.74: Middle East and Africa Electronic Skin Patches Market, 2018-2024
Figure 9.75: Middle East and Africa Market Dynamics
Figure 9.76: Middle East and Africa Electronic Skin Patches Market (by Type), 2018-2024
Figure 9.77: Middle East and Africa Electronic Skin Patches Market (by Application), 2018-2024
Figure 10.1: Abbott Laboratories: Overall Product Portfolio
Figure 10.2: Abbott Laboratories: Overall Financials, 2016-2018
Figure 10.3: Abbott Laboratories: Revenue (by Segment), 2016-2018
Figure 10.4: Abbott Laboratories: Revenue (by Region), 2016-2018
Figure 10.5: Abbott Laboratories: Research and Development Expense, 2016-2018
Figure 10.6: Abbott Laboratories: SWOT Analysis
Figure 10.7: BioTelemetry, Inc.: Overall Product Portfolio
Figure 10.8: BioTelemetry, Inc.: Overall Financials, 2016-2018
Figure 10.9: BioTelemetry, Inc.: Revenue (by Segment), 2016-2018
Figure 10.10: BioTelemetry, Inc.: Research and Development Expense, 2016-2018
Figure 10.11: BioTelemetry, Inc.: SWOT Analysis
Figure 10.12: DexCom, Inc.: Overall Product Portfolio
Figure 10.13: DexCom, Inc.: Overall Financials, 2016-2018
Figure 10.14: DexCom, Inc.: Revenue (by Region), 2016-2018
Figure 10.15: DexCom, Inc.: Research and Development Expense, 2016-2018
Figure 10.16: DexCom, Inc.: SWOT Analysis
Figure 10.17: General Electric Company: Overall Product Portfolio
Figure 10.18: General Electric Company: Overall Financials, 2016-2018
Figure 10.19: General Electric Company: Revenue (by Segment), 2016-2018
Figure 10.20: General Electric Company: Revenue (by Region), 2016-2018
Figure 10.21: General Electric Company: Research and Development Expense, 2016-2018
Figure 10.22: General Electric Company: SWOT Analysis
Figure 10.23: Insulet Corporation: Overall Product Portfolio
Figure 10.24: Insulet Corporation: Overall Financials, 2016-2018
Figure 10.25: Insulet Corporation: Research and Development Expense, 2016-2018
Figure 10.26: Insulet Corporation: SWOT Analysis
Figure 10.27: iRhythm Technologies, Inc.: Overall Product Portfolio
Figure 10.28: iRhythm Technologies, Inc.: Overall Financials, 2016-2018
Figure 10.29: iRhythm Technologies, Inc.: Research and Development Expense, 2016-2018
Figure 10.30: iRhythm Technologies, Inc.: SWOT Analysis
Figure 10.31: Koninklijke Philips N.V.: Product Portfolio for Global Electronic Skin Patches Market
Figure 10.32: Koninklijke Philips N.V.: Overall Financials, 2016-2018
Figure 10.33: Koninklijke Philips N.V.: Revenue (by Segment), 2016-2018
Figure 10.34: Koninklijke Philips N.V.: Revenue (by Region), 2016-2018
Figure 10.35: Koninklijke Philips N.V.: R&D Expenditure, 2016-2018
Figure 10.36: Koninklijke Philips N.V.: SWOT Analysis
Figure 10.37: LifeSignals: Overall Product Portfolio
Figure 10.38: LifeSignals: SWOT Analysis
Figure 10.39: Medtronic Plc: Product Portfolio for Electronic Skin Patches Market
Figure 10.40: Medtronic Plc: Overall Financials, 2017-2019
Figure 10.41: Medtronic Plc: Revenue (by Segment), 2017-2019
Figure 10.42: Medtronic Plc: Revenue (by Region), 2017-2019
Figure 10.43: Medtronic Plc: Research and Development Expense, 2017-2019
Figure 10.44: Medtronic Plc: SWOT Analysis
Figure 10.45: MC10, Inc.: Overall Product Portfolio
Figure 10.46: MC10, Inc.: SWOT Analysis
Figure 10.47: Nemaura Medical, Inc.: Overall Product Portfolio
Figure 10.48: Nemaura Medical, Inc.: Overall Financials, 2017-2019
Figure 10.49: Nemaura Medical, Inc.- Research and Development Expense, 2017-2019
Figure 10.50: Nemaura Medical, Inc.: SWOT Analysis
Figure 10.51: Omron Corporation: Product Portfolio for Global Electronic Skin Patches Market
Figure 10.52: Omron Corporation: Overall Financials, 2016-2018
Figure 10.53: Omron Corporation: Revenue by Segment, 2016-2018
Figure 10.54: Omron Corporation: Revenue by Region, 2016-2018
Figure 10.55: Omron Corporation: R&D Expenditure, 2016-2018
Figure 10.56: Omron Corporation: SWOT Analysis
Figure 10.57: Senseonics Holdings, Inc.: Overall Product Portfolio
Figure 10.58: Senseonics Holdings, Inc.: Overall Financials, 2016-2018
Figure 10.59: Senseonics Holdings, Inc.: Research and Development Expense, 2016-2018
Figure 10.60: Senseonics Holdings, Inc.: SWOT Analysis
Figure 10.61: VivaLNK: Overall Product Portfolio
Figure 10.62: VivaLNK: SWOT Analysis
Figure 10.63: VitalConnect: Overall Product Portfolio
Figure 10.64: VitalConnect: SWOT Analysis
Market Overview
Market Overview and Estimation
The advancements in emerging technology for the medical device industry, including connectivity technologies, wearable healthcare devices, digitalization technologies, and tracking systems have created new avenues for managing chronic diseases and to reduce the global economic burden
In addition, the several environmental factors, especially an increase in the radioactive, biological, and chemical factors, have increased the prevalence of lifestyle diseases. Thus, furthering the need for developing best therapeutic procedures, personalized medicine, and diagnostic procedures with minimum turnaround time.
The latest developments in device design, material science, assembly method, and chemical analysis techniques form the fundamentals of a highly distinguished aspect of wearable technology.
A patch is a wearable device that attaches to the skin. It is a stick-on patch that is worn on the body and is capable of collecting, monitoring, and transmitting wirelessly various health metrics, such as respiration, temperature, blood glucose, blood pressure, and heartbeat, to a smartphone.
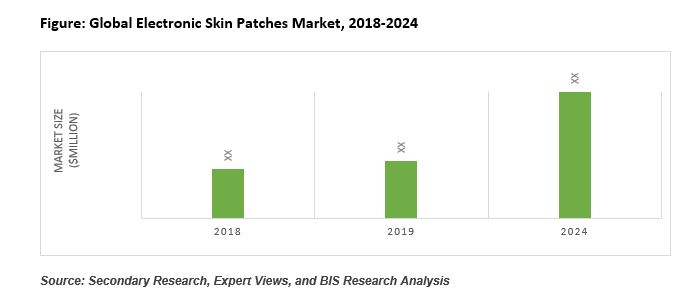
The global electronic skin patches market was valued at $3,899.1 million in 2018 and is anticipated to reach $9,957.9 million by 2024, witnessing a CAGR of 17.22% in the forecast period 2019-2024. The increasing healthcare expenditure and prevalence of chronic- and lifestyle-associated diseases have aided the increasing awareness and adoption of wearable devices, thus driving the growth of the global electronic skin patches market.
Growth Drivers
|
• Growing geriatric population leads to surge in exigency of electronic skin patches • Increasing burden of chronic and lifestyle-associated diseases elevating the requirement of continuous monitoring and treatment of a disease • Increasing healthcare expenditure • Growing prominence for point-of-care technologies • Increasing penetration of mobile platforms, tablets, and smartphones |
||
Market Challenges
|
• High Initial Cost and Design Complexity of Electronic Skin Patches Impeding the Growth in the Market • Lack of Data Security and Lack of Interoperability are Limiting the Adoption of Electronic Skin Patches |
||
Market Opportunities
|
• Untapped Market in Developing Economies • Scope for More Technologically Advanced Electronic Skin Patches |
Growth Factors
Growing Geriatric Population: The improvement in life expectancy is majorly due to significant advancement in diagnostic technology and medical science and improving awareness regarding health, nutrition, and hygiene. Increasing demand for better treatment facilities with an early diagnosis of chronic diseases surges the demand for advanced treatment facilities.
Increasing Burden of Chronic and Lifestyle-Associated Diseases: Sedentary lifestyle, changing diets, and growing obesity problems, have resulted in a massive economic burden of chronic and lifestyle-associated diseases. Globally, the mortality is increasing due to chronic illness such as stroke, cardiovascular diseases, and chronic neurological conditions, which leads to an increase in demand for electronic skin patches for point-of-care diagnosis and monitoring.
Increasing Inclination for Personal Health and Fitness: Patients today, are becoming more concerned about their personal health and fitness. The self-monitoring devices help the patients to avoid healthcare complications and delay in diagnosis and costly readmissions. The inclination for fitness is increasing among the adult population, leading to an increasing adoption of the health tracking devices.
Increasing Penetration of Mobile Platforms, Tablets, and Smartphones: Mobile users are rapidly switching over to the smartphones, due to more affordable 3G and 4G spectrum and increased adoption of other connected medical devices and mobile applications. The rapid adoption of smartphones has enhanced the demand for healthcare apps.
Key Questions Answered in this Report:
• What are the different types of electronic skin patches available in the market, and what are the benefits offered by them?
• What are the major drivers, challenges, and opportunities in the global electronic skin patches market?
• What are the key development strategies implemented by the key players to stand out in this market?
• What are the regulations pertaining to the global electronic skin patches market?
• What are the initiatives implemented by different governmental bodies regulating the development and commercialization of electronic skin patches?
• What are the leading companies dominating the global electronic skin patches market?
• What are the perceptions of the investors about the global electronic skin patches market?
• How many types of electronic skin patches are available in the market, and which are the companies offering these?
• Based on the application, which electronic skin patches application is anticipated to witness a massive rise in demand in the forecast period 2019-2024?
• What was the market value in 2018 of the leading segments and sub-segments of the global electronic skin patches market?
• How is each segment of the global electronic skin patches market expected to grow during the forecast period, and what is the revenue expected to be generated by each of the segments by the end of 2024?
• How is the industry anticipated to evolve during the forecast period 2019-2024?
• Which region is expected to contribute to the highest sales of the global electronic skin patches market during the forecast period?
• What are the leading trends and consumer preferences witnessed in global electronic skin patches markets?
Report Description
|
|||
|
2018 |
|
$3,899.1 million |
|
2019-2024 |
|
|
|
17.22% |
|
|
|
• Type – monitoring & diagnostic electronic skin patches and therapeutic electronic skin patches • Application - diabetes management, cardiovascular management and temperature monitoring, pain management, and others |
||
|
• North America – Canada and U.S. • Europe - U.K., Germany, France, Italy, Spain, and Rest-of-Europe • Asia-Pacific – China, India, and South Korea, Japan, Australia, and Rest-of-Asia-Pacific • Latin America - Brazil, Mexico, and Rest-of-Latin America • Middle East and Africa |
||
|
The key companies include Abbott Laboratories, BioTelemetry, Inc., DexCom, Inc., General Electric Company, Insulet Corporation, iRhythm Technologies, Inc., Koninklijke Philips N.V., LifeSignals, Medtronic, Plc., MC10, Inc., Omron Corporation, VivaLNK, and VitalConnect among others. |
Market Segmentation
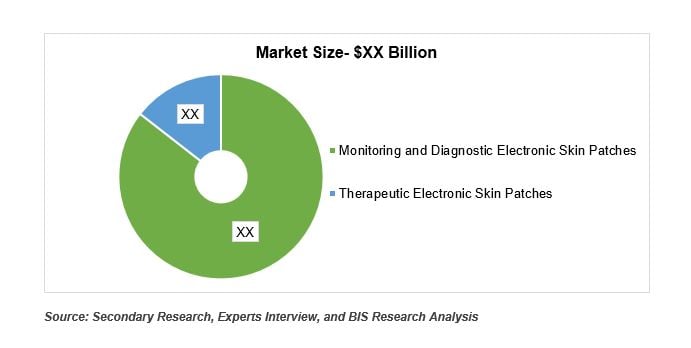
Market Outlook By Type
The global electronic skin patches market is segmented into two major types - monitoring and diagnostic electronic skin patches and therapeutic electronic skin patches. In 2018, the market was dominated by the monitoring and diagnostic electronic skin patches, which contributed maximum revenue to the total market share of electronic skin patches. Presence of significant number of companies with commercialized electronic skin patches products attributed to its highest contribution in the market.
By Application
On the basis of application, the electronic skin patches market is segmented into diabetes management, cardiovascular management and temperature monitoring, pain relief, and others. The diabetes management is the dominating application in the global electronic skin patches market. In 2018, the diabetes management segment accounted for maximum market share of global market revenue. Diabetes management segment is anticipated to witness a significant market growth rate during the forecast period. The massive burden of chronic and lifestyle associated diseases is the primitive factor promoting the growth of the global electronic skin patches market. In addition, cardiovascular management and temperature monitoring are anticipated to witness the highest growth rate during the forecast period.
By Region
North America currently holds the largest market share in terms of revenue generation. North America electronic skin patches market value in 2018 was highest among all regions. The market growth is expected to around a significant double digit CAGR during forecast period 2019-2024. The massive demand for point-of-care technologies among the geriatric population is the prominent factor propelling the growth of the North America electronic skin patches market. However, the market for the electronic skin patches market in Asia-Pacific is anticipated to witness the highest growth rate during the forecast period.
Global Electronic Skin Patches Market
Focus on Type, Application, 14 Countries’ Data, and Competitive Landscape – Analysis and Forecast, 2019-2024