Published Year: 2020
Global Electronic Skin Patches Market: Focus on Type, Application, 14 Countries’ Data, and Competi
The Global Electronic Skin Patches industry analysis by BIS Research projects the market to...
Focus on Usage Type, Application, End User, and Region - Analysis and Forecast, 2023-2031
Delivery Time: 1-5 Working Days
Get ISO Certified Research, Customization, Data Extraction, and Value-Added Services with All BIS Research Reports
BIS Research provides a comprehensive report library with unlimited access to data, insights, and market intelligence through Subscription.
Get Subscription Know More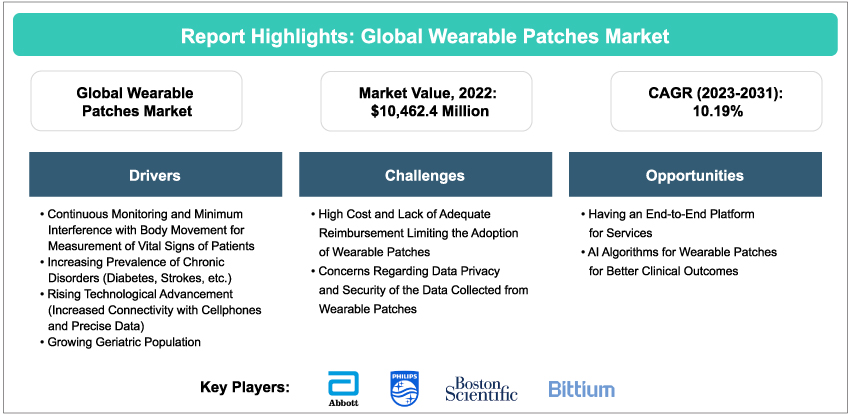
Introduction to the Global Wearable Patches Market
The global wearable patches market was valued at $10,462.4 million in 2022 and is expected to reach $26,892.7 million by 2031, growing at a CAGR of 10.19% between 2023 and 2031. The key factors driving the growth of the global wearable patches market include continuous monitoring of body vitals and minimum interference with body movement, increasing prevalence of chronic disorders (diabetes, strokes, etc.), rising technological advancement, and a growing geriatric population.
Wearable Patch: Introduction
Wearable patches represent a revolutionary advancement in the field of healthcare technology, offering a compact and non-invasive solution for monitoring various physiological parameters and delivering therapeutic interventions. These innovative patches are designed to adhere comfortably to the skin, providing continuous real-time data collection, analysis, and communication with healthcare professionals or individuals themselves.
Industrial Impact
Wearable patches have made an impact on the healthcare industry in the following ways:
Remote Patient Monitoring: Wearable patches are transforming healthcare by enabling continuous remote monitoring of patients with chronic illnesses. This reduces hospital readmissions, lowers healthcare costs, and improves patient outcomes.
Clinical Trials: Pharmaceutical companies and research organizations use wearable patches to collect real-time data from participants in clinical trials. This streamlined data collection enhances trial efficiency and provides more accurate insights into drug effectiveness and safety.
Elderly Care: Wearable patches play a crucial role in elderly care by providing caregivers and healthcare providers with valuable insights into the health and well-being of older adults. This technology can help prolong independent living and reduce the burden on caregivers.
Personalized Care for Patients: The data generated by wearable patches fuel the data analytics and AI industries. These technologies are used to process and interpret the vast amounts of health-related data collected from wearable medical patches, leading to insights for personalized healthcare.
Impact of COVID-19
The impact of COVID-19 on the global wearable patches market was as follows:
Increased Interest in Remote Monitoring: The pandemic has accelerated the adoption of remote patient monitoring solutions, including wearable technology Healthcare providers sought ways to minimize in-person visits, and wearable patches emerged as a valuable tool for monitoring COVID-19 patients and individuals with chronic illnesses from a distance.
Growth in Telehealth and Telemedicine: Wearable patches have become integral to telehealth and telemedicine services, which experienced significant growth during the pandemic. These patches enable real-time monitoring of patients during virtual consultations, enhancing the quality of remote healthcare.
Demand for Early Warning Systems: Healthcare institutions and governments have shown interest in wearable patches as early warning systems for COVID-19 symptoms. These patches can monitor vital signs, including body temperature and respiratory rate, which are crucial indicators of infection.
Regulatory Considerations: Regulatory agencies, such as the U.S. Food and Drug Administration (FDA), revised their policies to facilitate the rapid deployment of remote monitoring solutions, including wearable patches, during the public health emergency.
Market Segmentation:
Segmentation 1: by Usage Type
• Blood Glucose Patch
• Heart Rate and ECG Patch
• Temperature Patch
• TENS/EMS Patch
• Others
Blood Glucose Patches Dominate the Global Wearable Patches Market
Blood glucose patches are innovative medical devices designed for continuous monitoring of blood sugar levels in individuals with diabetes. These patches offer several advantages over traditional glucose monitoring methods, such as fingerstick tests. Some of its advantages are as follows:
Continuous Monitoring: Blood glucose patches provide real-time, continuous data on blood sugar levels. This constant monitoring helps individuals and healthcare providers make timely and informed decisions regarding insulin dosages, dietary choices, and overall diabetes management.
Minimized Discomfort: Unlike frequent fingerstick tests, which can be painful and inconvenient, wearable devices offer a more comfortable and non-invasive way to monitor blood glucose levels. They eliminate the need for frequent needle pricks.
Convenience: Wearable patches are discreet and can be worn underneath clothing, allowing individuals to monitor their glucose levels without drawing attention to themselves. This convenience encourages regular monitoring and adherence to treatment plans.
Data Trends: Blood glucose patches often come with accompanying mobile apps or software that display historical data and trends. This information can help individuals and healthcare providers identify patterns, adjust treatment plans, and improve diabetes management over time.
Alerts and Alarms: Many wearable patches are equipped with customizable alerts and alarms, sending timely notifications. These notifications can warn individuals of potential hypoglycemia (low blood sugar) or hyperglycemia (high blood sugar) episodes, enabling prompt action.
Segmentation 2: by Application
• Monitoring and Diagnostics
• Therapeutics
Monitoring and Diagnostics to be the Major Application in the Global Wearable Patches Market
Wearable patches are widely used for the monitoring and diagnosis of vital parameters such as blood pressure, pulse rate, and blood glucose levels. These are equipped with numerous sensors which can adhere to the skin using a skin adhesive. These patches are usually non-invasive, so they are patient-friendly as well.
Patches such as blood glucose patches, heart rate and ECG patches, temperature patches, and others are used for monitoring and diagnosis of various conditions. For instance, different key players operating in the market are providing products with unique value propositions such as long battery life, easy recharge, and maintenance. These patches provide real-time feedback on a person’s health condition and are used to monitor chronic disease conditions.
Segmentation 3: by End User
• Homecare
• Ambulatory Surgical Center
Homecare Segment to Continue to Dominate the Wearable Patches Market
Remote healthcare monitoring provides an efficient and cost-effective alternative to on-site clinical monitoring and allows the patient to continue to stay at home and prevent costly treatments from hospitals, clinics, or other nursing homes.
Segmentation 4: by Region
• North America - U.S., Canada
• Europe - Germany, U.K., France, Italy, Spain, and Rest-of-Europe
• Asia-Pacific - Japan, India, China, South Korea, Australia and New Zealand, and Rest-of-Asia-Pacific
• Latin America - Brazil, Mexico, and Rest-of-Latin America
• Middle East and Africa - U.A.E., K.S.A., and Rest-of-Middle East and Africa
China dominated the Asia-Pacific wearable patches market in 2022 with a share of 23.10%. The China wearable patches market is driven by factors such as an increase in the prevalence of chronic disease. Moreover, other factors, such as the rising technological advancements in connected care and the growing demand for remote patient monitoring, are also expected to drive the growth of the market in China.
Recent Developments in the Global Wearable Patches Market
• In August 2023, Theranica Bio-Electronics Ltd. received expanded CE mark approval under MDR European regulation for Nerivio as dual-use therapy for both acute and preventive treatment of migraine for adults and adolescents. The CE mark expansion for Nerivio is a critical milestone to accelerate the availability of the novel, drug-free migraine device into the European market.
• In June 2023, Abbott Laboratories announced that the U.S. Food and Drug Administration (FDA) cleared its FreeStyle Libre 2 and FreeStyle Libre 3 integrated continuous glucose monitoring (iCGM) system sensors for integration with automated insulin delivery (AID) systems.
• In June 2023, Insulet Corporation announced the commercial launch of its Omnipod 5 Automated Insulin Delivery System (Omnipod 5) for individuals aged two years and older with type 1 diabetes (T1D) in the U.K.
• In April 2023, the Medicare program expanded access to continuous glucose monitoring systems such as the FreeStyle Libre 2 and the FreeStyle Libre 14-day for insulin-using1 Medicare beneficiaries with diabetes, removing the prior requirement of multiple insulin injections on a daily basis.
Demand – Drivers, Limitations, and Opportunities
Market Drivers:
Continuous Monitoring and Minimum Interference with Body Movement for Measurement of Vital Signs of Patients: Continuous monitoring, also known as continuous control monitoring (CCM), gives protection and operations analysts immediate information on the general condition of IT infrastructure, including networks and cloud-deployed apps. The purpose of continuous monitoring and the rationale behind its adoption by businesses is to improve the system activity visibility and accountability.
There are many wearable patches that can measure vital indicators, including heart rate, respiration rate, oxygen saturation, and blood pressure. Compared to the hospital monitoring equipment used today, these gadgets are smaller and more user-friendly, accurate, and trustworthy.
Increasing Prevalence of Chronic Disorders (Diabetes, Strokes, etc.): Globally, the prevalence rate of illnesses and ailments is rising. These prevalent and expensive long-term health issues are steadily on the rise because of population aging and cultural and behavioral changes. Pandemics around the world are another growing epidemic. The pandemics of the last 10 years have amply illustrated how quickly illnesses spread over the world. The increase in chronic diseases will keep driving the market as the demand for continuous monitoring will turn out to be a necessity in the future.
Rising Technological Advancement (Increased Connectivity with Cell Phones and Precise Data): A wide variety of wearable technologies that can be used in healthcare have been developed with the help of the lifestyles and fitness markets. The four main vital signs, namely, temperature, heart rate, respiration rate, and blood pressure, as well as physical activity, perspiration, and emotion, are currently measured using existing technologies.
Devices that are small enough to be worn on a wrist as a penny-sized patch, sensors, and artificial intelligence (AI) advancements are assisting millions of people in detecting and managing chronic health issues and preventing serious sickness.
Growing Geriatric Population: The growing geriatric population across the globe is another factor responsible for driving the growth of the global wearable patches market. Chronic diseases are more common in the geriatric population.
Market Challenges:
High Cost and Lack of Adequate Reimbursement Limiting the Adoption of Wearable Medical Patches: The lack of adequate reimbursement policies and the high cost of wearable patches are among the major factors restraining the global wearable patches market. Many countries in regions such as Latin America the Middle East and Africa do not have established guidelines to regulate the use of wearable patches and, therefore, do not have reimbursement policies surrounding such devices.
Concerns Regarding Data Privacy and Security of the Data Collected from Wearable Patches: A lot of wearable technologies store information locally without encryption or information protection. As a result, there may be a significant chance of losing private and personal health information. Wireless communication methods that lack encryption are insufficient to protect data from a brute-force attack.
Market Opportunities:
End-to-End Platform for Services: The wearable patches have normally been integrated with platforms to save the monitored data. Fully labeled datasets are used to train supervised learning algorithms, which can then generate predictions about fresh data. The relationship between inputs and outcomes may be predicted and assessed using a clear framework.
AI Algorithms for Wearable Patches for Better Clinical Outcomes: A massive amount of data is being generated from tracking an individual's vital parameters, including heart rate, temperature, and oxygen level, among other health parameters. These data generated from wearable patches are being collected with the software. The use of AI helps understand each patient's body and alerts the physician if any change in the vital signs of the patient is being observed. Further incorporation of machine learning helps to develop a profile of each individual's vital signs.
Analyst’s Thoughts
According to Mridul Pasricha, senior analyst at BIS Research, “With the growing demand for painless and continuous remote monitoring of patients, the adoption of wearable patches is expected to increase globally. The Asia-Pacific wearable patches market, particularly, is expected to register significant growth during the forecast period 2023-2031.”
Focus on Usage Type, Application, End User, and Region - Analysis and Forecast, 2023-2031
A wearable patch is a small, flexible, and lightweight device that adheres to the skin, typically for monitoring various physiological parameters, delivering therapeutic treatments, or collecting health-related data. These patches have gained popularity in healthcare, wellness, and sports industries due to their convenience, comfort, and ability to provide continuous and real-time information.
The global wearable patches market was valued at $10,462.4 million in 2022 and is projected to reach $26,892.7 million by the end of 2031. Furthermore, the market is anticipated to grow at a CAGR of 10.19% during the forecast period 2023-2031.
A vast majority of players in the global wearable patches market engaged in regulatory activities and partnerships to bolster their market presence. Players also focused on product differentiation through innovation.
The following are the USPs of this report:
• Impact of COVID-19
• Patent analysis
• Product benchmarking
• Pricing trends, key companies, raw material manufacturers, recent developments, and units of wearable patches (by usage type) sold for each country
• Company profiles of emerging players
• The report provides a comprehensive list of raw material suppliers for wearable patches for over 15 countries.
• It also features a detailed analysis of the market (in terms of units sold and market size) for over 15 different countries.
• Further, it provides an extensive reimbursement landscape for such devices across different countries.
Medical technology companies offering wearable devices, as well as startups looking to enter the medical wearable technology market, should buy this report.
The Global Electronic Skin Patches industry analysis by BIS Research projects the market to...