Published Year: 2018
Global IoT in Agriculture Market - Analysis and Forecast (2018-2023): Focus on Systems (Sensing, Com
The IoT in agriculture market is projected to grow from $14.78 billion in the year 2018 to...
Focus on Solution (On-Cloud, On-Premise), Application (Crop Monitoring, Soil Analysis, Irrigation Monitoring), and Region
Delivery Time: 1-5 Working Days
Get ISO Certified Research, Customization, Data Extraction, and Value-Added Services with All BIS Research Reports
BIS Research provides a comprehensive report library with unlimited access to data, insights, and market intelligence through Subscription.
Get Subscription Know MoreMarket Overview and Estimation
As the world population stood at 7.7 billion in 2019, the pressure on the food and agriculture value chain to meet the global food demand is increasing with every passing day. With limited and continuously depleting natural resources and shrinking arable land due to urbanization, the need to optimize farm resources in order to produce agricultural commodities optimally is rising day by day.
In 2019, only 28.10% of the total employed population were working in the agricultural sectors. In comparison to 2000, the share has fallen drastically from the figure of 40.06%. To combat the problems related to rising food demand, leading technology providers are introducing innovative solutions in the farming arena. Technologies such as Geographic Information System (GIS) and Global Navigation Satellite Systems (GNSS) help farmers interpret, analyze, and assess data to make smart farming decisions.
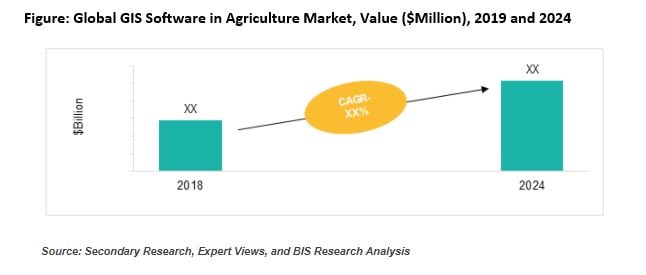
In our recently conducted industry analysis, the global GIS software in agriculture industry is projected to cater to a market revenue of $2.57 billion in 2024 as compared to $1.44 billion generated in 2018 while growing at a CAGR of 10.41 during the forecast period 2019-2024. The growing need to elevate farm produce has resulted in awareness among governments worldwide, which has contributed to the growth of this market. The massive usage of this technology also aims at solving the rising concerns over global food security, resulting in intensive investments from governments and stakeholders globally.
Substantial technological changes such as the integration of remote sensing equipment, implementation of Internet of Things (IoT) and Information and Communication Technologies (ICT), application of Artificial Intelligence (AI), and predictive analytics in the farming scenario, have fuelled the growth and adoption of GIS technologies for the purpose of yield forecasting, pest monitoring, crop monitoring, irrigation monitoring, and soil analysis, among others. Several GIS software providers are progressing towards making their solutions compatible with popular brands that offer drones in the agriculture space.
Some of the prominent players in the GIS software in agriculture market include ESRI, Trimble Inc., Topcon Corporation, Hexagon AB, Pix4D, Autodesk, Inc., and Oracle Corporation, among others. In order to create public awareness about their existing and new products and compete with their competitor’s product portfolio, key market players have ramped up their product launch activities in recent years. For instance, in 2019, Hexagon AB launched GeoMedia, which is an on-cloud GIS software solution for precision agriculture.
|
Growth Drivers |
• Tackling Global Food Insecurity • Favourable Government Initiatives and Investments • Growing Need for Precision Farming |
||
|
Market Challenges |
• High Initial Investment Costs • Availability of Open Source GIS Software and Applications |
||
|
Market Opportunities |
• Rising Opportunities in Developing Countries • Adoption of Drones in Agriculture |
||
Growth Factors
Tackling Global Food Insecurity
As per the recent report by the United Nations (UN), the world population reached an all-time high mark with 7.7 billion people in 2019. Due to factors such as the limited availability of natural resources and depleting arable land, global governments are actively involved in introducing efficient farm management practices to support the farming sector in achieving the goal of food self-sufficiency.
Favourable Government Initiatives and Investments
As the agriculture industry stands on the brink of technological revolution, developed and developing countries realize its importance and take initiatives to promote smart farming techniques. In the Asia-Pacific region, the government is providing support in terms of subsidy, regulations, and research in the related fields. Additionally, several governments and private research institutes, and favorable trade policies, are making efforts to identify the benefits of agricultural drone and robot solutions for augmenting global food production.
Growing Need for Precision Farming
As traditional farming approaches are being replaced with technological solutions, precision farming solutions are supporting farmers in field monitoring, plant health management, soil mapping, and smart irrigation, among others. The use of GIS software helps farmers capture, store, manipulate, analyze, manage, and present spatial or geographic data for their farms.
Focus on Solution (On-Cloud, On-Premise), Application (Crop Monitoring, Soil Analysis, Irrigation Monitoring), and Region
The IoT in agriculture market is projected to grow from $14.78 billion in the year 2018 to...
The precision agriculture market is projected to grow from $4.29 billion in the year 2018 to...
The smart farming market is projected to grow from $9,575.3 million in the year 2017 to...