Published Year: 2018
Global CubeSat Market - Analysis and Forecast, 2018-2022: Focus on Sizes (1U, 2U, 3U, 6U, and Other
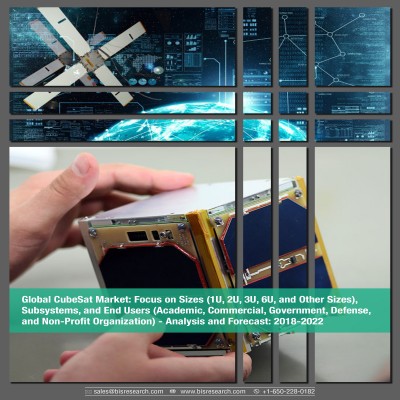
The CubeSat market reported a revenue of $363.8 million in 2017, and the commercial end user...
Focus on End User, Application, Mass, Subsegment, and Region
Delivery Time: 1-5 Working Days
Get ISO Certified Research, Customization, Data Extraction, and Value-Added Services with All BIS Research Reports
BIS Research provides a comprehensive report library with unlimited access to data, insights, and market intelligence through Subscription.
Get Subscription Know More
1.1 Market Drivers
1.1.1 Growing Demand for Cost-Effective Satellites
1.1.2 Increasing Capability of Electronic Technology
1.1.3 Ascending Demand for Small Satellite Constellations
1.2 Market Challenges
1.2.1 Developing Safe, Low-Cost, and Small Payload Nano Satellite to Launch Beyond Low-Earth Orbit
1.2.2 Removal of Space Debris
1.3 Market Opportunities
1.3.1 Growth of Nano Satellite in Disaster Management Applications
1.3.2 Development of Independent Global Navigation Satellite System (GNSS)
1.3.3 Emergence of Composite Material in Nano Satellites Structure
1.3.4 Development of Autonomous Nano Satellites
2.1 Overview
2.2 Key Market Strategies and Developments
2.2.1 Partnerships, Agreements, and Contracts
2.2.2 Product Launches
2.2.3 Mergers and Acquisitions
2.2.4 Other Developments
2.3 Competitive Benchmarking
3.1 Technological Scenario and Patent Analysis
3.1.1 Technological Scenario
3.1.1.1 3D Printed Nano Satellite
3.1.1.2 On-Board Internet System Powered Nano Satellite
3.1.2 Patent Analysis
3.2 Startup’s and Investment Scenario
3.3 Value Chain Analysis
3.4 Industry Attractiveness
3.4.1 Bargaining Power of Suppliers
3.4.2 Bargaining Power of Buyers
3.4.3 Threat of New Entrants
3.4.4 Threat of Substitutes
3.4.5 Intensity of Competitive Rivalry
4.1 Assumptions and Limitations
4.2 Market Overview
5.1 Market Overview
5.2 Communication
5.3 Earth Observation and Remote Sensing
5.4 Space Exploration
5.5 Technology Development and Demonstration
6.1 Market Overview
6.2 Academic
6.2.1 Global Nano Satellite Market Analysis for Academic End User (by Application)
6.3 Commercial
6.3.1 Global Nano Satellite Market Analysis for Commercial End User (by Application)
6.4 Government
6.4.1 Global Nano Satellite Market Analysis for Government End User (by Application)
6.5 Defense
6.5.1 Global Nano Satellite Market Analysis for Defense End User (by Application)
6.6 Non-Profit Organization
6.6.1 Global Nano Satellite Market Analysis for Non-Profit Organization End User (by Application)
7.1 Market Overview
7.2 1kg-3kg Nano Satellite
7.2.1 Global 1kg-3kg Nano Satellite Market Analysis (by Application)
7.3 4kg-6kg Nano Satellite
7.3.1 Global 4kg-6kg Nano Satellite Market Analysis (by Application)
7.4 7kg-10kg Nano Satellite
7.4.1 Global 7kg-10kg Nano Satellite Market Analysis (by Application)
8.1 Market Overview
8.2 Payload
8.3 Structure
8.4 Telecommunication
8.5 On-Board Computer
8.6 Power System
8.7 Attitude Control System
8.8 Propulsion System
9.1 Market Overview
9.2 North America
9.2.1 North America Nano Satellite Market Analysis (by End User)
9.2.2 U.S.
9.2.3 Canada
9.3 Europe
9.3.1 Europe Nano Satellite Market Analysis (by End User)
9.3.2 U.K.
9.3.3 Germany
9.3.4 France
9.3.5 Russia
9.3.6 Denmark
9.3.7 Rest-of-Europe
9.4 Asia-Pacific
9.4.1 Asia-Pacific Nano Satellite Market Analysis (by End User)
9.4.2 China
9.4.3 India
9.4.4 Japan
9.4.5 South Korea
9.4.6 Rest-of-Asia-Pacific
9.5 Rest-of-the-World
9.5.1 Rest-of-the-World Nano Satellite Market Analysis (by End User)
9.5.2 Middle East
9.5.3 Latin America
9.5.4 Africa
10.1 Ball Corporation
10.1.1 Company Overview
10.1.2 Product Offerings
10.1.3 Financials
10.1.3.1 Overall Financials
10.1.3.2 Financial Summary
10.1.4 SWOT Analysis
10.2 Clyde Space Ltd.
10.2.1 Company Overview
10.2.2 Product Offerings
10.2.3 SWOT Analysis
10.3 GomSpace A/S
10.3.1 Company Overview
10.3.2 Product Offerings
10.3.3 Financials
10.3.3.1 Overall Financials
10.3.3.2 Financial Summary
10.3.4 SWOT Analysis
10.4 Innovative Solutions In Space BV
10.4.1 Company Overview
10.4.2 Product Offerings
10.4.3 SWOT Analysis
10.5 Israel Aerospace Industries Ltd.
10.5.1 Company Overview
10.5.2 Product Offerings
10.5.3 Financials
10.5.3.1 Overall Financials
10.5.3.2 Financial Summary
10.5.4 SWOT Analysis
10.6 Lockheed Martin Corporation
10.6.1 Company Overview
10.6.2 Product Offerings
10.6.3 Financials
10.6.3.1 Overall Financials
10.6.3.2 Financial Summary
10.6.4 SWOT Analysis
10.7 NanoAvionika, LLC
10.7.1 Company Overview
10.7.2 Product Offerings
10.7.3 SWOT Analysis
10.8 Northrop Grumman Corporation
10.8.1 Company Overview
10.8.2 Product Offerings
10.8.3 Financials
10.8.3.1 Overall Financials
10.8.3.2 Financial Summary
10.8.4 SWOT Analysis
10.9 OHB SE
10.9.1 Company Overview
10.9.2 Product Offerings
10.9.3 Financials
10.9.3.1 Overall Financials
10.9.3.2 Financial Summary
10.9.4 SWOT Analysis
10.10 Planet Labs, Inc.
10.10.1 Company Overview
10.10.2 Product Offerings
10.10.3 SWOT Analysis
10.11 QinetiQ Group PLC
10.11.1 Company Overview
10.11.2 Product Offerings
10.11.3 Financials
10.11.3.1 Overall Financials
10.11.3.2 Financial Summary
10.11.4 SWOT Analysis
10.12 Sky and Space Global Ltd.
10.12.1 Product Offering
10.12.2 Financial Summary
10.12.3 SWOT Analysis
10.13 Space Systems/Loral, LLC (SSL)
10.13.1 Company Overview
10.13.2 Product Offerings
10.13.3 SWOT Analysis
10.14 The Boeing Company
10.14.1 Company Overview
10.14.2 Product Offerings
10.14.3 Financials
10.14.3.1 Overall Financials
10.14.3.2 Financial Summary
10.14.4 SWOT Analysis
10.15 Tyvak Nano-Satellite Systems, Inc.
10.15.1 Company Overview
10.15.2 Product Offerings
10.15.3 SWOT Analysis
10.16 Other Key Players
10.16.1 Aerial Maritime
10.16.2 Aistech Space
10.16.3 EnduroSat AD
10.16.4 Harris Corporation
10.16.5 Kepler Communications
10.16.6 NanoRacks LLC
10.16.7 Pumpkin Space
10.16.8 Satellogic
10.16.9 Spire Global Inc.
10.16.10 Surrey Satellite Technology
11.1 Scope of the Report
11.2 Global Nano Satellite Market Research Methodology
11.3 Assumptions and Limitations
12.1 Related Reports
Table 3.1 Patent Analysis: Small Satellite Capable of Formation Flying, and Formation of Multiple Small Satellites
Table 3.2 Patent Analysis: Camera Used for CubeSat, Antenna Integration System and Antenna Expansion Method
Table 3.3 Patent Analysis: Nano Satellite to Acquire High-Resolution Image
Table 3.4 Patent Analysis: Modular Nano Satellite Platform
Table 3.5 Patent Analysis: Compact Nano Satellite Sensor
Table 3.6 Start-up’s and Investment Scenario
Table 4.1 Payload Ranges for Satellites
Table 5.1 Nano Satellite Launches for Communication Application in 2017
Table 5.2 Nano Satellite Launches for Earth Observation and Remote Sensing Application in 2017
Table 5.3 Nano Satellite Launches for Space Exploration Application in 2017
Table 5.4 Nano Satellite Launches for Technology development and demonstration Application in 2017
Table 6.1 Global Nano Satellite Market (by End User), $Million, 2017-2023
Table 8.1 Global Nano Satellite Market (by Subsystem), $Million, 2017-2023
Table 9.1 Global Nano Satellite Market Size (by Region), $Million, 2017-2023
Figure 1 Contribution by Space Agencies in Nano Satellite Market
Figure 2 Global Nano Satellite Market Overview, 2018 and 2023
Figure 3 Global Nano Satellite Market, 2017-2023
Figure 4 Global Nano Satellite Market (by Subsystem), $Million, 2017 and 2023
Figure 5 Global Nano Satellite Market (by End-User), 2017 and 2023
Figure 6 Global Nano Satellite Market (by Application), 2017-2023
Figure 7 Global Nano Satellite Market (by Mass), 2017-2023
Figure 8 Global Nano Satellite Market (by Region), 2017-2023
Figure 1.1 Global Nano Satellite Market: Impact Analysis on Market Drivers, Challenges, and Opportunities
Figure 1.2 Nano Satellite: Growth Roadmap
Figure 1.3 Major Currently Operational or Announced Small Satellite Constellations
Figure 1.4 Nano Satellite: Remote Sensing for Disaster Management
Figure 1.5 GNSS Operational Constellations
Figure 2.1 Some of the Organic and Inorganic Growth Strategies Adopted by the Key Players
Figure 2.2 Percentage Share of Strategies Adopted by the Market Players, 2014-2018
Figure 2.3 Partnerships, Agreements, and Contracts Adopted by Key Market Players, 2015-2018
Figure 2.4 Product Launches by the Key Market Players, 2015-2018
Figure 2.5 Mergers and Acquisitions Adopted by the Key Market Players, 2017
Figure 2.6 Other Developments by the Key Market Players, 2015-2018
Figure 2.7 Nano Satellite: Competitive Benchmarking
Figure 3.1 3D Printing Scenario for Different Industries
Figure 3.2 Nano Satellite: Value Chain Analysis
Figure 3.3 Nano Satellite: Porter’s Five Forces
Figure 3.4 Bargaining Power of Suppliers
Figure 3.5 Bargaining Power of Buyers
Figure 3.6 Threat of New Entrants
Figure 3.7 Threat of Substitutes
Figure 3.8 Intensity of Competitive Rivalry
Figure 4.1 Global Nano Satellite Market, 2017-2023
Figure 5.1 Classification of Global Nano Satellite Market (by Application), Market Share (%) 2017
Figure 5.2 Global Nano Satellite Market (by Application), 2017 and 2023
Figure 5.3 Global Nano Satellite Market (by Communication Application), 2017-2023
Figure 5.4 Nano Satellite Market for Earth Observation and Remote Sensing Application
Figure 5.5 Global Nano Satellite Market (by Earth Observation and Remote Sensing Application), 2017-2023
Figure 5.6 Global Nano Satellite Market (by Space Exploration Application), 2017-2023
Figure 5.7 Global Nano Satellite Market (by Technology Development and Demonstration Application), 2017-2023
Figure 6.1 Classification of Global Nano Satellite Market (by End User and Key Players )
Figure 6.2 Global Nano Satellite Market (by End User), 2017 and 2023
Figure 6.3 Global Nano Satellite Market (by Academic End User), 2017-2023
Figure 6.4 Global Nano Satellite Market Analysis for Academic End User (by Application), $Million, 2017 and 2023
Figure 6.5 Global Nano Satellite Market (by Commercial End User), 2017-2023
Figure 6.6 Global Nano Satellite Market Analysis for Commercial End User (by Application), $Million, 2017 and 2023
Figure 6.7 Global Nano Satellite Market (by Government End User), 2017-2023
Figure 6.8 Global Nano Satellite Market Analysis for Government End User (by Application), $Thousand, 2017 and 2023
Figure 6.9 Global Nano Satellite Market (by Defense End User), 2017-2023
Figure 6.10 Global Nano Satellite Market Analysis for Defense End User (by Application), $Thousand, 2017 and 2023
Figure 6.11 Global Nano Satellite Market (by Non-Profit Organization End User), 2017-2023
Figure 6.12 Global Nano Satellite Market Analysis for Non-Profit Organization End User (by Application), $Thousand, 2017 and 2023
Figure 7.1 Global Nano Satellite Market (by Mass), 2017 and 2023
Figure 7.2 Global 1kg-3kg Nano Satellite Market, 2017-2023
Figure 7.3 Global 1kg-3kg Nano Satellite Market (by Application), $Million, 2017 and 2023
Figure 7.4 Global 4kg-6kg Nano Satellite Market, 2017-2023
Figure 7.5 Global 4kg-6kg Nano Satellite Market (by Application), $Million, 2017 and 2023
Figure 7.6 Global 7kg-10kg Nano Satellite Market, 2017-2023
Figure 7.7 Global 7kg-10kg Nano Satellite Market (by Application), $Million, 2017 and 2023
Figure 8.1 Global Nano Satellite Market (by Subsystem), $Million, 2017-2023
Figure 8.2 Global Nano Satellite Market (by Payload Subsystem), $Million, 2017-2023
Figure 8.3 Global Nano Satellite Market (by Structure Subsystem), $Million, 2017-2023
Figure 8.4 Global Nano Satellite Market (by Telecommunication Subsystem), $Million, 2017-2023
Figure 8.5 Global Nano Satellite Market (by On-Board Computer Subsystem), $Million, 2017-2023
Figure 8.6 Global Nano Satellite Market (by Power System Subsystem), $Million, 2017-2023
Figure 8.7 Global Nano Satellite Market (by Attitude Control Subsystem), $Million, 2017-2023
Figure 8.8 Global Nano Satellite Market (by Propulsion System Subsystem), $Million, 2017-2023
Figure 9.1 Classification of Global Nano Satellite Market (by Region)
Figure 9.2 Regional Distribution of Nano Satellite Market, 2017-2023
Figure 9.3 North America Nano Satellite Market, 2017-2023
Figure 9.4 North America Nano Satellite Market (by End User), $Million, 2017 and 2023
Figure 9.5 U.S. Nano Satellite Market Size, $Million, 2017-2023
Figure 9.6 Canada Nano Satellite Market Size, $Million, 2017-2023
Figure 9.7 Europe Nano Satellite Market, 2017-2023
Figure 9.8 Europe Nano Satellite Market (by End User), $Million, 2017 and 2023
Figure 9.9 U.K. Nano Satellite Market Size, $Million, 2017-2023
Figure 9.10 Germany Nano Satellite Market Size, $Million, 2017-2023
Figure 9.11 France Nano Satellite Market Size, $Million, 2017-2023
Figure 9.12 Russia Nano Satellite Market Size, $Million, 2017-2023
Figure 9.13 Denmark Nano Satellite Market Size, $Million, 2017-2023
Figure 9.14 Rest of Europe Nano Satellite Market Size, $Million, 2017-2023
Figure 9.15 Asia-Pacific Nano Satellite Market, 2017-2023
Figure 9.16 Asia-Pacific Nano Satellite Market (by End User), $Thousand
Figure 9.17 China Nano Satellite Market Size, $Million, 2017-2023
Figure 9.18 India Nano Satellite Market Size, $Million, 2017-2023
Figure 9.19 Japan Nano Satellite Market Size, $Million, 2017-2023
Figure 9.20 South Korea Nano Satellite Market Size, $Million, 2017-2023
Figure 9.21 Rest-of-Asia-Pacific Nano Satellite Market Size, $Million, 2017-2023
Figure 9.22 Rest-of-the-World Nano Satellite Market, 2017-2023
Figure 9.23 Rest of the World Nano Satellite Market (by End User), $Thousand, 2017 and 2023
Figure 9.24 Middle East Nano Satellite Market Size, $Million, 2017-2023
Figure 9.25 Latin America Nano Satellite Market Size, $Thousand, 2018-2023
Figure 9.26 Africa Nano Satellite Market Size, $Million, 2017-2023
Figure 10.1 Share of Key Company Profiles
Figure 10.2 Ball Corporation: Product Offerings
Figure 10.3 Ball Corporation – Overall Financials, 2015-2017
Figure 10.4 Ball Corporation – Revenue by Business Segment, 2015-2017
Figure 10.5 Ball Corporation – Revenue by Geography, 2015-2017
Figure 10.6 Ball Corporation: SWOT Analysis
Figure 10.7 Clyde Space Ltd.: Product Offerings
Figure 10.8 Clyde Space Ltd.: SWOT Analysis
Figure 10.9 GomSpace A/S: Product Offerings
Figure 10.10 GomSpace A/S: Overall Financials, 2015-2017
Figure 10.11 GomSpace A/S: Share in Overall Revenue by Region, 2015-2017
Figure 10.12 GomSpace A/S: SWOT Analysis
Figure 10.13 Innovative Solutions in Space BV: Product Offerings
Figure 10.14 Innovative Solutions in Space BV: SWOT Analysis
Figure 10.15 Israel Aerospace Industries Ltd.: Product Offerings
Figure 10.16 Israel Aerospace Industries Ltd. – Overall Financials, 2015-2017
Figure 10.17 Israel Aerospace Industries Ltd. – Business Segment Revenue Mix, 2015-2017
Figure 10.18 Israel Aerospace Industries Ltd.: SWOT Analysis
Figure 10.19 Lockheed Martin Corporation: Product Offerings
Figure 10.20 Lockheed Martin Corporation – Overall Financials, 2015-2017
Figure 10.21 Lockheed Martin Corporation – Revenue by Business Segment, 2015-2017
Figure 10.22 Lockheed Martin Corporation – Revenue by Geography, 2015-2017
Figure 10.23 Lockheed Martin Corporation: SWOT Analysis
Figure 10.24 NanoAvionika, LLC: Product Offerings
Figure 10.25 NanoAvionika, LLC – SWOT Analysis
Figure 10.26 Northrop Grumman Corporation: Product Offerings
Figure 10.27 Northrop Grumman Corporation – Overall Financials, 2015-2017
Figure 10.28 Northrop Grumman Corporation – Revenue by Business Segment, 2015-2017
Figure 10.29 Northrop Grumman Corporation Revenue by Geography, 2015-2017
Figure 10.30 Northrop Grumman Corporation – SWOT Analysis
Figure 10.31 OHB SE: Product Offerings
Figure 10.32 OHB SE: Overall Financials, 2015-2017
Figure 10.33 OHB SE: Revenue by Business Segment, 2015-2017
Figure 10.34 OHB SE: Share in Overall Revenue by Region, 2015-2017
Figure 10.35 OHB SE: SWOT Analysis
Figure 10.36 Planet Labs, Inc.: Product Offerings
Figure 10.37 Planet Labs, Inc. – SWOT Analysis
Figure 10.38 QinetiQ Group PLC: Product Offerings
Figure 10.39 QinetiQ Group PLC – Overall Financials, 2016-2018
Figure 10.40 QinetiQ Group PLC – Revenue by Business Segment, 2016-2018
Figure 10.41 QinetiQ Group PLC – Share in Overall Revenue by Region, 2016-2018
Figure 10.42 QinetiQ Group PLC – SWOT Analysis
Figure 10.52 Sky and Space Global Ltd: SWOT Analysis
Figure 10.43 Space Systems/Loral, LLC: Product Offerings
Figure 10.44 Space Systems/Loral, LLC: SWOT Analysis
Figure 10.45 The Boeing Company: Product Offerings
Figure 10.46 The Boeing Company: Overall Financials, 2015-2017
Figure 10.47 The Boeing Company: Revenue by Business Segment, 2015-2017
Figure 10.48 The Boeing Company: Share in Overall Revenue by Region, 2015-2017
Figure 10.49 The Boeing Company: SWOT Analysis
Figure 10.50 Tyvak Nano-Satellite Systems, Inc.: Product Offerings
Figure 10.51 Tyvak Nano-Satellite Systems, Inc.: SWOT Analysis
Figure 11.1 Global Nano Satellite Market Segmentation
Figure 11.2 Secondary Data Sources
Figure 11.3 Top Down and Bottom Up Approach
Figure 11.4 Nano Satellite Market Influencing Factors
Figure 11.5 Assumptions and Limitations
• This report identifies the global nano satellite market under different segments such as end user, mass, subsystem, application, and region.
• It examines the prime demand-side factors, which affect the growth of the market, and the current and future trends, market drivers, restraints, and challenges prevalent in the global nano satellite market.
• The report also highlights the value chain of the industry.
• Detailed competitive analysis has been included in this report which focuses on the ¬key market developments and strategies followed by the top players in the market. Additionally, the competitive benchmarking of the prominent companies has been included in the existing study, which analyzes the competitive strength of the players in the global nano satellite market.
• The market for different end user such as defense, academic, commercial, government, and non-profit, has been estimated and analyzed.
• Different applications, such as communication, earth observation and remote sensing, space exploration, technology development, and demonstration, have been estimated and analyzed in the report.
• The market analysis depending on the mass 1kg-3kg, 4kg-6kg, and 7kg-10kg, has been estimated and analyzed in the report.
• The market for different subsystem such as payload, structure, telecommunication, on-board computer, power system, attitude control system, and propulsion system, has been estimated and analyzed.
• The global nano satellite market has been analyzed in the report for the major regions including North America, Europe, Asia-Pacific, and Rest-of-the-World.
• The study provides detailed analysis of the 15 key players in the global nano satellite market, including: GomSpace A/S, OHB SE, The Boeing Company, Ball Corporation, Israel Aerospace Indsutries Ltd. , Lockheed Martin Corporation, Northrop Grummen Corporation, QinetiQ Group Plc, NanoAvionika, LLC, Space Systems/Loral, LLC (SSL), and Tyvak Nano-Satellite Systems, Inc., in the Company Profiles section. This section covers business financials, company snapshots, key products and services, major developments, future programs (if any), and the individual SWOT analysis.
The governments and space organizations worldwide are continuously increasing their funding in the space industry to develop efficient and cost-effective satellite solutions. Currently, the space industry is at the cusp of a major revolution, as more than 3,600 small satellites, including nano, micro, and pico, are expected to be launched over the course of next ten years. Nano satellites, in particular, are emerging as a promising market in the small satellite industry. According to National Aeronautics and Space Administration (NASA), nano satellites, also known as NanoSat, range from 1-10 kg mass.
The global nano satellite market is driven by several factors, wherein, the leading ones are advancement in the satellite miniaturization, increase in capability of electronic technology, and increase in demand for small satellite constellation. As more nations are launching their nano satellite constellations, demand for the nano satellite is anticipated to grow over the coming years. Globally, defense forces have been showing interest in potential advantages of using nano satellite constellations for certain military applications. These systems can replace one large satellite with a cluster of nano satellites in a single orbital location. It is expected that once the technology becomes available, nano satellite constellation systems will perform better, cost less to launch, and operate equivalent to conventional satellite systems.
Some of the key players in the nano satellite industry are Ball Corporation, Clyde Space Ltd., Airbus S.A.S., Deep Space Industries, Inc., Innovative Solutions In Space BV, Interorbital Systems, Israel Aerospace Industries Ltd., Lockheed Martin Corporation, NanoAvionika, LLC, Northrop Grumman Corporation, OHB SE, Planet Labs, Inc., QinetiQ Group PLC, Terra Bella, The Boeing Company, and Tyvak Inc. These companies are aiming for a wide range of product launches and collaborations to expand their operations and compete in the market. Apart from these, several companies, such as OneWeb, NanoRacks LLC, Satellogic, Kepler Communications, Aistech Space, Aerial Maritime, and Sky and Space Global, are also emerging in the market. These companies are expected to drive huge growth in the market during the forecast period, 2018-2023.
The market reported a revenue of $143.7 million in 2017 and is expected to grow at a significant CAGR during the forecast period 2018-2023. The global nano satellite market has been segmented into five end-users: academic, commercial, government, defense, and non-profit organization. The commercial end-user acquired the largest share; however, non-profit organization end-user are expected to grow at the highest CAGR during the forecast period, 2018-2023. In addition, the global nano satellite market is also classified depending upon the applications, such as communication, earth observation and remote sensing, space exploration, and technology development and demonstration. Earth observation and remote sensing reported the highest revenue in 2017, however, communication is estimated to grow at the highest CAGR during the forecast period, 2018-2023. In addition, the nano satellite market has also been segmented based on mass (1-3kg, 4-6kg, and 7-10kg categories) and subsystem (payload, structure, telecommunication, on-board computer, power system, attitude control system, and propulsion system).
North America accounted for the highest share of the market in 2017, owing to the maximum number of nano satellite launches by NASA (U.S.) and American entrepreneurs have made considerable amount of transformational developments in the region to explore space by deploying cost-effective small satellite constellations. In addition, RoW is expected to witness the highest growth during the forecast period, 2018-2023, mainly driven by continued efforts of the respective governments in development of satellite technologies to transform the national economy and strengthen security.
The nano satellite market is experiencing an advanced rate of growth over the past couple of years, due to the increasing demand of satellite applications in commercial, defense and military, and government end users. With the high scale of growth of the nano satellite industry, a new range of programs is being carried out to develop latest nano satellite technologies. The growing demand of small satellite constellations for satellite applications, such as earth monitoring, remote sensing and communication, is the major factor driving the growth of nano satellite market. Moreover, continuous advancements in electronic satellite equipment, for instance, 3D printed electronic circuitry for nano satellite equipment, are expected to boost the growth of the market during the forecast period, 2018-2023. In terms of revenue, nano satellite market generated $143.7 million in the year 2017.
According to BIS Research analysis, the global nano satellite market generated $143.7 million in 2017 and is estimated to grow at a CAGR of 13.43% during 2018-2023. North America dominated the global nano satellite market in 2017 with the U.S. acquiring the most significant market share, globally. However, Asia-Pacific is expected to have the highest growth rate during the forecast period 2018-2023.
Focus on End User, Application, Mass, Subsegment, and Region
The CubeSat market reported a revenue of $363.8 million in 2017, and the commercial end user...
The airborne LiDAR system market reported a revenue of $732.4 million in 2016, and the UAV...
The small satellites market reported a revenue of $2,528.1 million in 2016, and the government...
1. Please contact us to discuss customization options, and we can confirm the time and cost (if any). For minor customization requirements that would take 3-5 days, we do not charge any additional amount.
2. All BIS Research reports are delivered to clients via our InsightMonk platform. This allows the customers to extract the data in Excel for their use. Excel is provided for all License types and is not limited to just enterprise users.
3. Additionally, all customers also get access to the following complimentary value-added services from BIS Research.
*Expert Consultation Charges applicable