A quick peek into the report
Table of Contents
1.1 Market Overview and Ecosystem
1.2 Market Trends
1.2.1 Impact Analysis
1.2.2 Advancements in Computed Radiography through Image Quality, Dose Optimization, and Workflow Automation
1.3 Regulatory Landscape
1.3.1 North America
1.3.1.1 U.S.
1.3.1.2 Canada
1.3.2 Europe
1.3.2.1 EU Countries
1.3.2.2 U.K.
1.3.3 Asia-Pacific
1.3.3.1 Japan
1.3.3.2 China
1.3.3.3 India
1.3.4 Latin America
1.3.4.1 Brazil
1.3.4.2 Mexico
1.3.5 Middle East and Africa
1.3.5.1 KSA
1.3.5.2 South Africa
1.4 Supply Chain Analysis
1.5 Market Dynamics
1.5.1 Drivers, Challenges, and Opportunities: Current and Future Impact Assessment
1.5.2 Market Drivers
1.5.2.1 Cost-Effective Digitization of Existing X-ray Infrastructure
1.5.3 Market Restraints
1.5.3.1 Growing Replacement Pressure from Direct Digital Radiography
1.5.3.2 Slower Workflow due to Cassette-Based Image Processing
1.5.4 Market Opportunities
1.5.4.1 Expanding CR Adoption in Low- and Middle-Income Countries with Limited Imaging Access
2.1 Overview
2.1.1 Orthopedic Imaging
2.1.2 Chest Imaging
2.1.3 Dental Imaging
2.1.4 Others
3.1 Overview
3.1.1 Hospitals
3.1.2 Orthopedic and Specialty Centers
3.1.3 Diagnostics Imaging Centers
3.1.4 Other End Users
4.1 Regional Summary
4.2 North America
4.2.1 Regional Overview
4.2.2 Driving Factors for Market Growth
4.2.3 Factors Challenging the Market
4.2.4 Market Sizing and Forecast
4.2.4.1 U.S.
4.2.4.1.1 Country Overview
4.2.4.1.2 Driving Factors for Market Growth
4.2.4.1.3 Factors Challenging the Market
4.2.4.1.4 Market Sizing and Forecast
4.2.4.2 Canada
4.2.4.2.1 Country Overview
4.2.4.2.2 Driving Factors for Market Growth
4.2.4.2.3 Factors Challenging the Market
4.2.4.2.4 Market Sizing and Forecast
4.3 Europe
4.3.1 Regional Overview
4.3.2 Driving Factors for Market Growth
4.3.3 Factors Challenging the Market
4.3.4 Market Sizing and Forecast
4.3.4.1 U.K.
4.3.4.1.1 Country Overview
4.3.4.1.2 Driving Factors for Market Growth
4.3.4.1.3 Factors Challenging the Market
4.3.4.1.4 Market Sizing and Forecast
4.3.4.2 Germany
4.3.4.2.1 Country Overview
4.3.4.2.2 Driving Factors for Market Growth
4.3.4.2.3 Factors Challenging the Market
4.3.4.2.4 Market Sizing and Forecast
4.3.4.3 France
4.3.4.3.1 Country Overview
4.3.4.3.2 Driving Factors for Market Growth
4.3.4.3.3 Factors Challenging the Market
4.3.4.3.4 Market Sizing and Forecast
4.3.4.4 Italy
4.3.4.4.1 Country Overview
4.3.4.4.2 Driving Factors for Market Growth
4.3.4.4.3 Factors Challenging the Market
4.3.4.4.4 Market Sizing and Forecast
4.3.4.5 Spain
4.3.4.5.1 Country Overview
4.3.4.5.2 Driving Factors for Market Growth
4.3.4.5.3 Factors Challenging the Market
4.3.4.5.4 Market Sizing and Forecast
4.3.4.6 Rest-of-the- Europe
4.3.4.6.1 Country Overview
4.3.4.6.2 Driving Factors for Market Growth
4.3.4.6.3 Factors Challenging the Market
4.3.4.6.4 Market Sizing and Forecast
4.4 Asia Pacific
4.4.1 Regional Overview
4.4.2 Driving Factors for Market Growth
4.4.3 Factors Challenging the Market
4.4.4 Market Sizing and Forecast
4.4.4.1 China
4.4.4.1.1 Country Overview
4.4.4.1.2 Driving Factors for Market Growth
4.4.4.1.3 Factors Challenging the Market
4.4.4.1.4 Market Sizing and Forecast
4.4.4.2 Japan
4.4.4.2.1 Country Overview
4.4.4.2.2 Driving Factors for Market Growth
4.4.4.2.3 Factors Challenging the Market
4.4.4.2.4 Market Sizing and Forecast
4.4.4.3 India
4.4.4.3.1 Country Overview
4.4.4.3.2 Driving Factors for Market Growth
4.4.4.3.3 Factors Challenging the Market
4.4.4.3.4 Market Sizing and Forecast
4.4.4.4 Australia
4.4.4.4.1 Country Overview
4.4.4.4.2 Driving Factors for Market Growth
4.4.4.4.3 Factors Challenging the Market
4.4.4.4.4 Market Sizing and Forecast
4.4.4.5 South Korea
4.4.4.5.1 Country Overview
4.4.4.5.2 Driving Factors for Market Growth
4.4.4.5.3 Factors Challenging the Market
4.4.4.5.4 Market Sizing and Forecast
4.4.4.6 Rest-of-the-Asia Pacific
4.4.4.6.1 Country Overview
4.4.4.6.2 Driving Factors for Market Growth
4.4.4.6.3 Factors Challenging the Market
4.4.4.6.4 Market Sizing and Forecast
4.5 Latin America
4.5.1 Regional Overview
4.5.2 Driving Factors for Market Growth
4.5.3 Factors Challenging the Market
4.5.4 Market Sizing and Forecast
4.5.4.1 Brazil
4.5.4.1.1 Country Overview
4.5.4.1.2 Driving Factors for Market Growth
4.5.4.1.3 Factors Challenging the Market
4.5.4.1.4 Market Sizing and Forecast
4.5.4.2 Mexico
4.5.4.2.1 Country Overview
4.5.4.2.2 Driving Factors for Market Growth
4.5.4.2.3 Factors Challenging the Market
4.5.4.2.4 Market Sizing and Forecast
4.5.4.3 Rest-of-Latin America
4.5.4.3.1 Country Overview
4.5.4.3.2 Driving Factors for Market Growth
4.5.4.3.3 Factors Challenging the Market
4.5.4.3.4 Market Sizing and Forecast
4.6 Middle East and Africa
4.6.1 Regional Overview
4.6.2 Driving Factors for Market Growth
4.6.3 Factors Challenging the Market
4.6.4 Market Sizing and Forecast
4.6.4.1 K.S.A
4.6.4.1.1 Country Overview
4.6.4.1.2 Driving Factors for Market Growth
4.6.4.1.3 Factors Challenging the Market
4.6.4.1.4 Market Sizing and Forecast
4.6.4.2 U.A.E.
4.6.4.2.1 Country Overview
4.6.4.2.2 Driving Factors for Market Growth
4.6.4.2.3 Factors Challenging the Market
4.6.4.2.4 Market Sizing and Forecast
4.6.4.3 South Africa
4.6.4.3.1 Country Overview
4.6.4.3.2 Driving Factors for Market Growth
4.6.4.3.3 Factors Challenging the Market
4.6.4.3.4 Market Sizing and Forecast
4.6.4.4 Rest-of-Middle East and Africa
4.6.4.4.1 Country Overview
4.6.4.4.2 Driving Factors for Market Growth
4.6.4.4.3 Factors Challenging the Market
4.6.4.4.4 Market Sizing and Forecast
5.1 Key Developments Analysis (by Company), September 2022-September 2025
5.2 Company Profiles
5.2.1 Agfa-Gevaert Group
5.2.1.1 Overview
5.2.1.2 Top Products/Product Portfolio
5.2.1.3 Top Competitors
5.2.1.4 Target Customers
5.2.1.5 Key Personnel
5.2.1.6 Analyst View
5.2.2 FUJIFILM Corporation
5.2.2.1 Overview
5.2.2.2 Top Products/Product Portfolio
5.2.2.3 Top Competitors
5.2.2.4 Target Customers
5.2.2.5 Key Personnel
5.2.2.6 Analyst View
5.2.3 Konica Minolta, Inc.
5.2.3.1 Overview
5.2.3.2 Top Products/Product Portfolio
5.2.3.3 Top Competitors
5.2.3.4 Target Customers
5.2.3.5 Key Personnel
5.2.3.6 Analyst View
5.2.4 Carestream Health
5.2.4.1 Overview
5.2.4.2 Top Products/Product Portfolio
5.2.4.3 Top Competitors
5.2.4.4 Target Customers
5.2.4.5 Key Personnel
5.2.4.6 Analyst View
5.2.5 ACTEON Group
5.2.5.1 Overview
5.2.5.2 Top Products/Product Portfolio
5.2.5.3 Top Competitors
5.2.5.4 Target Customers
5.2.5.5 Key Personnel
5.2.5.6 Analyst View
5.2.6 CRUXELL Corp.
5.2.6.1 Overview
5.2.6.2 Top Products/Product Portfolio
5.2.6.3 Top Competitors
5.2.6.4 Target Customers
5.2.6.5 Key Personnel
5.2.6.6 Analyst View
5.2.7 iCRco, Inc.
5.2.7.1 Overview
5.2.7.2 Top Products/Product Portfolio
5.2.7.3 Top Competitors
5.2.7.4 Target Customers
5.2.7.5 Key Personnel
5.2.7.6 Analyst View
5.2.8 Dürr Dental SE
5.2.8.1 Overview
5.2.8.2 Top Products/Product Portfolio
5.2.8.3 Top Competitors
5.2.8.4 Target Customers
5.2.8.5 Key Personnel
5.2.8.6 Analyst View
5.2.9 Envista Holdings Corporation
5.2.9.1 Overview
5.2.9.2 Top Products/Product Portfolio
5.2.9.3 Top Competitors
5.2.9.4 Target Customers
5.2.9.5 Key Personnel
5.2.9.6 Analyst View
5.2.10 Air Techniques Inc.
5.2.10.1 Overview
5.2.10.2 Top Products/Product Portfolio
5.2.10.3 Top Competitors
5.2.10.4 Target Customers
5.2.10.5 Key Personnel
5.2.10.6 Analyst View
5.2.11 Cefla s.c.
5.2.11.1 Overview
5.2.11.2 Top Products/Product Portfolio
5.2.11.3 Top Competitors
5.2.11.4 Target Customers
5.2.11.5 Key Personnel
5.2.11.6 Analyst View
5.2.12 Planmeca Oy
5.2.12.1 Overview
5.2.12.2 Top Products/Product Portfolio
5.2.12.3 Top Competitors
5.2.12.4 Target Customers
5.2.12.5 Key Personnel
5.2.12.6 Analyst View
6.1 Data Sources
6.1.1 Primary Data Sources
6.1.2 Secondary Data Sources
6.1.3 Data Triangulation
6.2 Market Estimation and Forecast
Table 1: Market Snapshot
Table 2: Global Computed Radiography Market (by Region), $Million, 2024-2036
Table 3: Global Computed Radiography Market (by Applications), $Million, 2024-2036
Table 4: Global Computed Radiography Market (End Users), $Million, 2024-2036
Table 5: North America Computed Radiography Market (by Region), $Million, 2024-2036
Table 6: North America Computed Radiography Market (by Applications), $Million, 2024-2036
Table 7: North America Computed Radiography Market (End Users), $Million, 2024-2036
Table 8: U.S. Computed Radiography Market (by Applications), $Million, 2024-2036
Table 9: U.S. Computed Radiography Market (End Users), $Million, 2024-2036
Table 10: Canada Computed Radiography Market (by Applications), $Million, 2024-2036
Table 11: Canada Computed Radiography Market (End Users), $Million, 2024-2036
Table 12: Europe Computed Radiography Market (by Region), $Million, 2024-2036
Table 13: Europe Computed Radiography Market (by Applications), $Million, 2024-2036
Table 14: Europe Computed Radiography Market (End Users), $Million, 2024-2036
Table 15: U.K. Computed Radiography Market (by Applications), $Million, 2024-2036
Table 16: U.K. Computed Radiography Market (End Users), $Million, 2024-2036
Table 17: Germany Computed Radiography Market (by Applications), $Million, 2024-2036
Table 18: Germany Computed Radiography Market (End Users), $Million, 2024-2036
Table 19: France Computed Radiography Market (by Applications), $Million, 2024-2036
Table 20: France Computed Radiography Market (End Users), $Million, 2024-2036
Table 21: Italy Computed Radiography Market (by Applications), $Million, 2024-2036
Table 22: Italy Computed Radiography Market (End Users), $Million, 2024-2036
Table 23: Spain Computed Radiography Market (by Applications), $Million, 2024-2036
Table 24: Spain Computed Radiography Market (End Users), $Million, 2024-2036
Table 25: Rest-of-Europe Computed Radiography Market (by Applications), $Million, 2024-2036
Table 26: Rest-of-Europe Computed Radiography Market (End Users), $Million, 2024-2036
Table 27: Asia-Pacific Computed Radiography Market (by Region), $Million, 2024-2036
Table 28: Asia-Pacific Computed Radiography Market (by Applications), $Million, 2024-2036
Table 29: Asia-Pacific Computed Radiography Market (End Users), $Million, 2024-2036
Table 30: China Computed Radiography Market (by Applications), $Million, 2024-2036
Table 31: China Computed Radiography Market (End Users), $Million, 2024-2036
Table 32: Japan Computed Radiography Market (by Applications), $Million, 2024-2036
Table 33: Japan Computed Radiography Market (End Users), $Million, 2024-2036
Table 34: India Computed Radiography Market (by Applications), $Million, 2024-2036
Table 35: India Computed Radiography Market (End Users), $Million, 2024-2036
Table 36: Australia Computed Radiography Market (by Applications), $Million, 2024-2036
Table 37: Australia Computed Radiography Market (End Users), $Million, 2024-2036
Table 38: South Korea Computed Radiography Market (by Applications), $Million, 2024-2036
Table 39: South Korea Computed Radiography Market (End Users), $Million, 2024-2036
Table 40: Rest-of-Asia-Pacific Computed Radiography Market (by Applications), $Million, 2024-2036
Table 41: Rest-of-Asia-Pacific Computed Radiography Market (End Users), $Million, 2024-2036
Table 42: Latin America Computed Radiography Market (by Region), $Million, 2024-2036
Table 43: Latin America Computed Radiography Market (by Applications), $Million, 2024-2036
Table 44: Latin America Computed Radiography Market (End Users), $Million, 2024-2036
Table 45: Brazil Computed Radiography Market (by Applications), $Million, 2024-2036
Table 46: Brazil Computed Radiography Market (End Users), $Million, 2024-2036
Table 47: Mexico Computed Radiography Market (by Applications), $Million, 2024-2036
Table 48: Mexico Computed Radiography Market (End Users), $Million, 2024-2036
Table 49: Rest-of-Latin America Computed Radiography Market (by Applications), $Million, 2024-2036
Table 50: Rest-of-Latin America Computed Radiography Market (End Users), $Million, 2024-2036
Table 51: Middle East and Africa Computed Radiography Market (by Region), $Million, 2024-2036
Table 52: Middle East and Africa Computed Radiography Market (by Applications), $Million, 2024-2036
Table 53: Middle East and Africa Computed Radiography Market (End Users), $Million, 2024-2036
Table 54: K.S.A. Computed Radiography Market (by Applications), $Million, 2024-2036
Table 55: K.S.A. Computed Radiography Market (End Users), $Million, 2024-2036
Table 56: U.A.E. Computed Radiography Market (by Applications), $Million, 2024-2036
Table 57: U.A.E. Computed Radiography Market (End Users), $Million, 2024-2036
Table 58: South Africa Computed Radiography Market (by Applications), $Million, 2024-2036
Table 59: South Africa Computed Radiography Market (End Users), $Million, 2024-2036
Table 60: Rest-of-Middle East and Africa Computed Radiography Market (by Applications), $Million, 2024-2036
Table 61: Rest-of-Middle East and Africa Computed Radiography Market (End Users), $Million, 2024-2036
Table 62: Global Computed Radiography Market, Key Strategies and Developments (by Company), Sep 2022-Sep 2025
Figure 1: Global Computed Radiography Market (by Scenario), $Million, 2025, 2026, and 2036
Figure 2: Global Computed Radiography Market, 2025 and 2036
Figure 3: Global Computed Radiography Market (by Country), $Million, 2025
Figure 4: Global Computed Radiography Market Snapshot
Figure 5: Global Computed Radiography Market, $Million, 2025 and 2036
Figure 6: Computed Radiography Market (by Application), $Million, 2025, 2028, and 2036
Figure 7: Computed Radiography Market (by End User), $Million, 2025, 2030, and 2036
Figure 8: Supply Chain Analysis for the Global Computed Radiography Market
Figure 9: Global Computed Radiography Market (by Application), $Million, 2025, 2029, and 2036
Figure 10: Global Computed Radiography Market (Orthopedic Imaging), $Million, 2024-2036
Figure 11: Global Computed Radiography Market (Chest Imaging), $Million, 2024-2036
Figure 12: Global Computed Radiography Market (Dental Imaging), $Million, 2024-2036
Figure 13: Global Computed Radiography Market (Others), $Million, 2024-2036
Figure 14: Global Computed Radiography Market (by End User), $Million, 2025, 2029, and 2036
Figure 15: Global Computed Radiography Market (Hospitals), $Million, 2024-2036
Figure 16: Global Computed Radiography Market (Orthopedic and Specialty Centers), $Million, 2024-2036
Figure 17: Global Computed Radiography Market (Diagnostics Imaging Centers), $Million, 2024-2036
Figure 18: Global Computed Radiography Market (Other End Users), $Million, 2024-2036
Figure 19: North America Computed Radiography Market, $Million, 2024-2036
Figure 20: U.S. Computed Radiography Market, $Million, 2024-2036
Figure 21: Canada Computed Radiography Market, $Million, 2024-2036
Figure 22: Europe Computed Radiography Market, $Million, 2024-2036
Figure 23: U.K. Computed Radiography Market, $Million, 2024-2036
Figure 24: Germany Computed Radiography Market, $Million, 2024-2036
Figure 25: France Computed Radiography Market, $Million, 2024-2036
Figure 26: Italy Computed Radiography Market, $Million, 2024-2036
Figure 27: Spain Computed Radiography Market, $Million, 2024-2036
Figure 28: Rest-of-Europe Computed Radiography Market, $Million, 2024-2036
Figure 29: Asia-Pacific Computed Radiography Market, $Million, 2024-2036
Figure 30: China Computed Radiography Market, $Million, 2024-2036
Figure 31: Japan Computed Radiography Market, $Million, 2024-2036
Figure 32: India Computed Radiography Market, $Million, 2024-2036
Figure 33: Australia Computed Radiography Market, $Million, 2024-2036
Figure 34: South Korea Computed Radiography Market, $Million, 2024-2036
Figure 35: Rest-of-Asia-Pacific Computed Radiography Market, $Million, 2024-2036
Figure 36: Latin America Computed Radiography Market, $Million, 2024-2036
Figure 37: Brazil Computed Radiography Market, $Million, 2024-2036
Figure 38: Mexico Computed Radiography Market, $Million, 2024-2036
Figure 39: Rest-of- Latin America Computed Radiography Market, $Million, 2024-2036
Figure 40: Middle East and Africa Computed Radiography Market, $Million, 2024-2036
Figure 41: K.S.A. Computed Radiography Market, $Million, 2024-2036
Figure 42: U.A.E. Computed Radiography Market, $Million, 2024-2036
Figure 43: South Africa Computed Radiography Market, $Million, 2024-2036
Figure 44: Rest-of- Middle East and Africa Computed Radiography Market, $Million, 2024-2036
Figure 45: Data Triangulation
Figure 46: Top-Down and Bottom-Up Approach
Figure 47: Assumptions and Limitations
Computed Radiography Market Report Coverage
|
Computed Radiography Market |
|||
|
Base Year |
2025 |
Market Size in 2025 |
$466.3 Million |
|
Forecast Period |
2026-2036 |
Value Projection and Estimation by 2036 |
$548.9 Million |
|
CAGR During Forecast Period |
1.52% |
Number of Pages |
162 |
|
Number of Tables |
62 |
Number of Figures |
47 |
Key Market Players and Competition Synopsis
The companies profiled have been selected based on inputs gathered from an analysis of company coverage, product portfolio, and market penetration.
Some prominent names established in this market are:
• Agfa-Gevaert Group
• FUJIFILM Corporation
• Konica Minolta, Inc.
• Carestream Health
• ACTEON Group
• CRUXELL Corp.
• iCRco, Inc.
• Dürr Dental SE
• Envista Holdings Corporation
• Air Techniques Inc.
• Cefla s.c.
• Planmeca Oy
How can this report add value to an organization?
Product/Innovation Strategy: The global computed radiography market has been divided into several key segments, including application, end user, and regional markets. By understanding which applications, healthcare settings, and regions continue to rely on computed radiography, this report offers valuable insights for organizations looking to refine their product and innovation strategies.
Growth/Marketing Strategy: Affordable digital conversion, replacement demand, rural diagnostic expansion, and public-sector imaging modernization are anticipated to be central to the growth of the computed radiography market. Key developments among CR system manufacturers, imaging solution providers, distributors, and healthcare facilities are shaping market adoption, especially in cost-sensitive and infrastructure-constrained settings.
Competitive Strategy: The computed radiography market is competitive and increasingly replacement-driven, with established imaging companies and regional players competing through affordability, compact system design, service support, workflow connectivity, and compatibility with existing X-ray rooms. Key market players are focusing on sustaining CR relevance through improved image processing, durable imaging plates, PACS integration, and lifecycle support rather than large-scale hardware innovation.
Methodology
Key Considerations and Assumptions in Market Engineering and Validation
• Years from 2024 to 2036 have been considered for the global market size estimation, 2025 has been considered as the base year, and 2026 to 2036 as the forecast period.
• The scope of the report is based on comprehensive inputs from industry experts across various sectors, including hospitals, diagnostic imaging centers, dental clinics, orthopedic facilities, public-sector healthcare providers, CR system manufacturers, imaging solution providers, distributors, and research institutions.
• The market contribution of computed radiography is anticipated to grow moderately in the future, with projections based on historical analysis of available solutions.
• Revenues from companies have been sourced from their annual reports for FY2024 and FY2025. For private companies, revenue estimates have been derived from primary research inputs, funding history, market collaborations, and operational performance.
• The market has been mapped based on the existing computed radiography products and systems. Key companies with significant offerings in computed radiography systems have been identified and profiled in this report.
Primary Research
The primary sources involve industry experts from the healthcare industry and various stakeholders, such as computed radiography system manufacturers, radiology department professionals, and academic and research institutions. Respondents such as CEOs, vice presidents, marketing directors, radiology professionals, and technology and innovation directors have been interviewed to obtain and verify both qualitative and quantitative aspects of this research study.
The key data points taken from the primary sources include:
• validation and triangulation of all the numbers and graphs
• validation of report segmentations and key qualitative findings
• understanding the competitive landscape and business model
• current and proposed production values of a product by market players
• validation of the numbers of different segments of the market in focus
• percentage split of individual markets for regional analysis
Secondary Research
Open Sources
• Certified publications, articles from recognized authors, white papers, directories, and major databases, among others
• Annual reports, SEC filings, and investors’ presentations of the leading market players
• Company websites and a detailed study of their product portfolio
• Gold standard magazines, journals, white papers, press releases, and news articles
• Paid databases
The key data points taken from the secondary sources include:
• segmentations and percentage shares
• data for market value
• key industry trends of the top players in the market
• qualitative insights into various aspects of the market, key trends, and emerging areas of innovation
• quantitative data for mathematical and statistical calculations
Global Computed Radiography Market Industry Overview

Introduction of the Computed Radiography Market
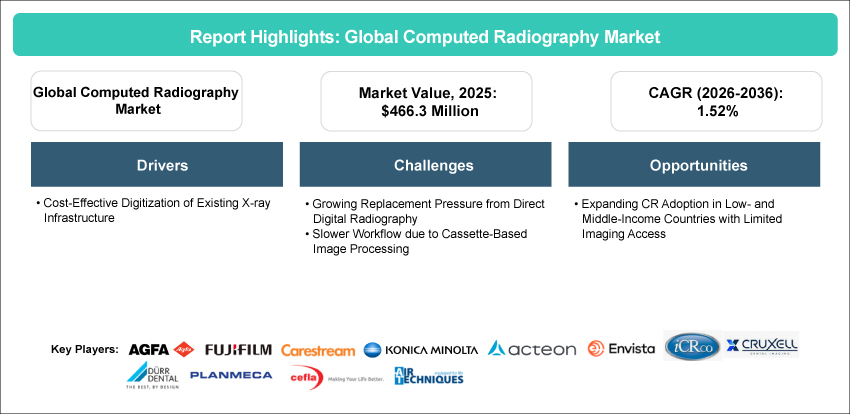
The global computed radiography market, initially valued at $466.3 million in 2025, is projected to grow substantially, reaching $548.9 million by 2036, with a remarkable compound annual growth rate (CAGR) of 1.52% from 2026 to 2036.
The global computed radiography market is experiencing moderate growth, driven by the continued need for affordable digital conversion of conventional X-ray workflows and the broader shift toward digital diagnostics. Computed radiography (CR) uses photostimulable phosphor imaging plates, cassettes, CR readers/scanners, and image processing software to convert X-ray exposures into digital images. The technology remains relevant for hospitals, diagnostic imaging centers, dental clinics, orthopedic practices, rural facilities, and public-sector healthcare providers that require digital image storage, retrieval, sharing, and reporting capabilities without replacing existing X-ray infrastructure. As a bridge between film-based radiography and direct digital radiography, computed radiography enables healthcare facilities to convert conventional X-ray workflows into digital imaging environments while reducing film processing, chemical handling, physical archiving, and manual image management. Its compatibility with PACS/RIS platforms and ability to extend the usability of installed X-ray rooms continue to make it a practical option for cost-sensitive and infrastructure-constrained healthcare settings pursuing phased digital diagnostics adoption.
Technological advancements are reshaping the computed radiography landscape, with improvements in compact CR readers, reusable imaging plates, image processing software, dose optimization, mini-PACS functionality, and workflow connectivity playing an important role in sustaining market relevance. Despite the market’s growth prospects, challenges such as the increasing preference for direct digital radiography, slower image availability, cassette-based workflow limitations, and replacement pressure in high-volume hospitals remain significant. However, ongoing demand from smaller healthcare facilities, mobile diagnostic units, dental and orthopedic clinics, and emerging markets is expected to support continued adoption of computed radiography as an affordable and phased pathway toward digital imaging modernization.
Market Introduction
The global computed radiography market has undergone a gradual transition, shaped by the need for affordable digital conversion of conventional X-ray imaging workflows. Computed radiography continues to serve as a bridge technology for healthcare facilities that require digital image capture, storage, sharing, and reporting capabilities without replacing their existing X-ray infrastructure. Companies are increasingly focusing on compact CR readers, reusable photostimulable phosphor imaging plates, cassette-based systems, image processing software, and PACS-compatible workflow solutions to support cost-effective digitization. Noteworthy developments, such as compact tabletop readers, mini-PACS functionality, improved image processing, dose optimization, and mobile-compatible CR configurations, underscore the industry’s focus on extending the practical value of CR in lower-volume, space-constrained, and cost-sensitive healthcare settings. As direct digital radiography adoption continues to increase in high-throughput hospitals, computed radiography is expected to remain relevant in selected markets, particularly among smaller hospitals, diagnostic centers, dental clinics, orthopedic practices, rural facilities, and public-sector providers seeking phased digital modernization.
Industrial Impact
The global computed radiography market has witnessed steady adoption, driven by the continued demand for affordable digital imaging solutions and the need to modernize conventional X-ray workflows without full system replacement. Key players such as Carestream Health, Agfa-Gevaert Group, FUJIFILM Corporation, Konica Minolta, Inc., and other regional providers play a central role in supporting cost-effective radiography digitization through CR readers, reusable imaging plates, cassettes, image processing software, and PACS-compatible workflow solutions. These offerings are crucial across routine applications such as chest imaging, orthopedic imaging, dental radiography, trauma assessment, and general radiography, enabling healthcare facilities to reduce film dependence, improve image storage and retrieval, and support more efficient reporting workflows. By extending the usability of existing X-ray infrastructure, reducing the burden of chemical processing and physical archiving, and enabling digital image sharing, computed radiography continues to contribute to more accessible diagnostic imaging. The market’s impact is most visible in smaller hospitals, diagnostic imaging centers, rural facilities, public-sector providers, and cost-sensitive markets, where CR remains an important bridge between analog radiography and full direct digital radiography adoption.
Market Segmentation:
Segmentation 1: By Application
• Orthopedic Imaging
• Chest Imaging
• Dental Imaging
• Others
Chest Imaging Segment to Dominate the Computed Radiography Market (by Application)
In terms of application, the chest imaging segment is expected to lead the computed radiography market, accounting for a significant share due to the high volume of chest X-ray examinations performed across routine diagnostic, emergency, inpatient, and outpatient settings. Chest imaging remains widely used for the assessment and monitoring of respiratory infections, pneumonia, tuberculosis, chronic obstructive pulmonary disease, trauma, lung abnormalities, and cardiac-related conditions. Moreover, as chest X-rays are frequently repeated for diagnosis, follow-up, and pre-operative evaluation, healthcare facilities continue to rely on CR systems where affordability, existing X-ray infrastructure utilization, and workflow digitization are key priorities.
Segmentation 2: By End User
• Hospitals
• Orthopedic and Specialty Clinics
• Diagnostic Imaging Centers
• Other End Users
Hospitals to Dominate the Computed Radiography Market (by End User)
In terms of end user, the hospitals segment is anticipated to lead the computed radiography market, accounting for a significant share due to the high volume of routine and urgent diagnostic imaging procedures performed across hospital departments. Hospitals use computed radiography across emergency care, inpatient wards, outpatient departments, orthopedics, chest imaging, trauma assessment, and surgical evaluation, where cost-effective digital image acquisition and reliable workflow support remain important. Computed radiography enables hospitals to digitize existing X-ray rooms, improve PACS-compatible image storage and retrieval, reduce dependence on film processing, and support more efficient reporting workflows without requiring immediate full-system replacement. The segment is further supported by the presence of trained radiology staff, established imaging infrastructure, and recurring demand for X-ray examinations across multiple clinical departments.
Segmentation 3: By Region
• North America
o U.S.
o Canada
• Europe
o U.K.
o Germany
o France
o Italy
o Spain
o Rest-of-Europe
• Asia-Pacific
o China
o Japan
o India
o Australia
o South Korea
o Rest-of-Asia-Pacific
• Latin America
o Brazil
o Mexico
o Rest-of-Latin America
• Middle East and Africa
o K.S.A.
o U.A.E.
o South Africa
o Rest-of-Middle East and Africa
Asia-Pacific to Dominate the Computed Radiography Market (by Region)
In terms of region, Asia-Pacific is expected to lead the computed radiography market, accounting for a significant share due to the continued demand for affordable radiography digitization across cost-sensitive and infrastructure-developing healthcare systems. The region includes a large base of hospitals, diagnostic imaging centers, dental clinics, orthopedic practices, rural healthcare facilities, and public-sector providers that continue to rely on existing X-ray infrastructure. Computed radiography offers these facilities a practical route to transition from film-based workflows to digital image capture, storage, sharing, and reporting without the higher upfront investment required for direct digital radiography systems. The segment is further supported by hospital infrastructure expansion, rural diagnostic access initiatives, growing imaging procedure volumes, and the need to improve PACS-compatible workflow efficiency. As healthcare providers across emerging Asia-Pacific markets continue to prioritize phased modernization, affordability, compact deployment, and reduced dependence on film processing, computed radiography is expected to maintain a strong position in the regional market.
Recent Developments in the Computed Radiography Market
• In September 2025, Carestream introduced Image Suite V4 Software MR 11 for CR and DR imaging systems, adding AI-enabled companion images such as bone suppression, pneumothorax visualization, and enhanced tube/line visualization to improve diagnostic confidence. The update also includes SmartGrid Technology, cross-system detector sharing, and customizable image looks to enhance workflow and patient experience.
• In May 2024, Carestream Health launched Image Suite MR 10 Software for CR and DR imaging systems in May 2024, designed to improve radiographer productivity, imaging efficiency, and user experience. The update adds features such as Focus HD detector support, DR Total Quality Testing, CR mammography enhancements, and optional DR long-length imaging auto-stitching.
Demand – Drivers, Challenges, and Opportunities
Market Drivers:
Cost-Effective Digitization of Existing X-ray Infrastructure: The need for affordable digitization of existing X-ray infrastructure remains a key factor driving demand for computed radiography systems. Many healthcare facilities, particularly in cost-sensitive markets across Asia-Pacific, Latin America, the Middle East and Africa, and selected European regions, continue to operate functional analog or film-based X-ray systems. For these facilities, the priority is not immediate replacement with direct digital radiography, but the gradual reduction of film dependency, chemical processing, darkroom operations, and physical image storage. Computed radiography addresses this need by enabling digital image capture through reusable photostimulable phosphor plates, cassettes, CR readers, and image processing software while allowing providers to continue using existing X-ray rooms. This makes CR a practical solution for phased modernization, particularly among smaller hospitals, diagnostic centers, rural facilities, and public-sector providers with limited capital budgets. By supporting PACS-compatible image storage, easier sharing, improved reporting workflows, and lower recurring consumable costs compared with conventional film radiography, computed radiography provides a manageable route toward digital imaging adoption.
Market Challenges:
Growing Replacement Pressure from Direct Digital Radiography: The increasing replacement of computed radiography by direct digital radiography remains a key restraint for the computed radiography market. While CR continues to support affordable digitization of existing X-ray infrastructure, its cassette-based workflow requires additional steps such as plate handling, reader-based scanning, image processing, and periodic plate maintenance. In contrast, direct digital radiography uses flat-panel detectors to capture images directly and enables faster image availability, improved workflow efficiency, lower radiation dose, and better image consistency. This makes DR more attractive for high-volume hospitals, trauma centers, orthopedic departments, and advanced diagnostic imaging facilities where throughput, dose optimization, and diagnostic confidence are important procurement priorities. As healthcare providers increasingly move beyond basic digitization toward fully digital and automated radiography workflows, CR becomes less competitive for new installations and higher-end upgrades. Although CR remains relevant in cost-sensitive and transitional facilities, the stronger clinical and operational value proposition of DR is gradually narrowing CR’s addressable market. This shift is expected to limit long-term growth, particularly in digitally mature healthcare systems where hospitals are prioritizing faster imaging workflows, improved dose performance, and more integrated radiography platforms.
Market Opportunities:
Expanding CR Adoption in Low- and Middle-Income Countries with Limited Imaging Access: The expansion of computed radiography in low- and middle-income countries represents a significant growth opportunity, as access to basic diagnostic imaging remains uneven across many healthcare systems. X-ray imaging continues to be one of the most essential first-line diagnostic tools for chest infections, trauma, orthopedic conditions, tuberculosis screening, and emergency care. However, many smaller hospitals, rural diagnostic centers, public-sector facilities, and community-level healthcare providers continue to face limitations related to advanced imaging infrastructure, capital budgets, trained workforce, and digital connectivity. Computed radiography addresses this gap by enabling facilities to digitize existing analog X-ray workflows without immediately replacing the full X-ray room. While direct digital radiography offers stronger long-term workflow efficiency, its higher upfront investment may restrict deployment in resource-constrained settings. As governments and healthcare organizations continue to expand affordable diagnostic access and rural imaging services, computed radiography is expected to remain a practical bridge technology for facilities seeking basic digital imaging capability with controlled capital expenditure.
Analyst’s Thoughts
According to Priyanshi Upadhyay, Research Analyst - BIS Research, “The computed radiography market is expected to witness steady but selective growth, driven by the continued need for affordable digital conversion of existing X-ray infrastructure, particularly across cost-sensitive and underserved healthcare settings. While direct digital radiography is increasingly preferred in high-volume hospitals due to faster image availability, improved workflow efficiency, and stronger dose performance, computed radiography continues to hold relevance as a practical bridge technology for facilities that cannot immediately replace functional analog X-ray systems. Its ability to reduce dependence on film processing, support PACS-compatible image management, and enable phased radiology modernization makes it important for smaller hospitals, diagnostic centers, dental clinics, rural facilities, and public-sector providers. With demand increasingly concentrated in emerging markets and lower-volume healthcare environments, the market’s long-term opportunity will depend on affordability, service support, compact system design, and workflow connectivity rather than major hardware innovation.”
Computed Radiography Market - A Global and Regional Analysis
Focus on Application, End User, and Region - Analysis and Forecast, 2026-2036
Frequently Asked Questions
Computed radiography is a cassette-based digital X-ray imaging technology that uses reusable photostimulable phosphor imaging plates to capture X-ray exposures and convert them into digital images through a CR reader or scanner. It enables healthcare facilities to digitize existing analog X-ray systems without replacing the entire X-ray room, supporting digital image storage, retrieval, sharing, reporting, and PACS-compatible workflows.
To strengthen their market position, companies are focusing on affordable digital conversion solutions, compact CR reader design, durable reusable imaging plates, improved image processing software, and PACS or mini-PACS integration. Many players are also targeting smaller hospitals, diagnostic centers, dental clinics, orthopedic practices, rural facilities, and cost-sensitive healthcare markets where existing X-ray systems remain functional and full direct digital radiography adoption may be financially difficult. Service support, distribution reach, workflow connectivity, and lifecycle management are also becoming important competitive strategies.
The following are the USPs of this report:
• Market regulations and key trends in the computed radiography market
• Market dynamic analysis of the opportunities, trends, and challenges in the market
This report is valuable for computed radiography system manufacturers, imaging plate and cassette providers, diagnostic imaging companies, distributors, hospitals, diagnostic imaging centers, dental clinics, orthopedic facilities, public-sector healthcare providers, and investors involved in radiography infrastructure and digital imaging solutions.