
Published Year: 2020
Global 3D Holographic Display and Services Market: Focus on Product (Pseudo Holographic, Spinning LE
The global 3D holographic display and services market is projected to grow from $607.6 million...
Focus on AR, VR, MR, Solution (Hardware, Software, Services), Application (Entertainment, Gaming, Education, Manufacturing, Healthcare), Funding, Patents, ROI, and 20+ Countries - Analysis and Forecast, 2020-2025
Delivery Time: 1-5 Working Days
Get ISO Certified Research, Customization, Data Extraction, and Value-Added Services with All BIS Research Reports
BIS Research provides a comprehensive report library with unlimited access to data, insights, and market intelligence through Subscription.
Get Subscription Know MoreMarket Size, Forecast, and Analysis
Figure: Extended Reality Market Snapshot
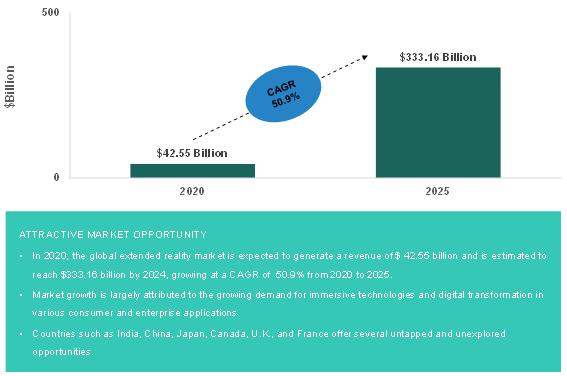
Source: Expert Interviews and BIS Research Analysis
The extended reality market is projected to grow from $42.55 billion in 2020 to $333.16 billion by 2025, at a CAGR of 50.9% from 2020 to 2025. The growth in the extended reality market is expected to be driven by the ongoing trend of industry 4.0 and digital transformation. Extended reality technologies are based on spatial computing concepts, which is expected to put a significant change in currently available computing solutions.
The extended reality technology has garnered adoption in various end-use segments such as consumer and enterprise applications. During the forecast period, the extended reality market is aligned more toward the consumer applications, such as gaming, entertainment, and educations. Gaming application has the highest potential for XR during the forecast period, since XR elevates consumer experience and allows users to either fully immerse into virtual environment or interact with the virtual content, which is not possible in the traditional gaming platforms. Education sector is also expected to have significant use of XR technologies. The traditional ways of teaching or delivering lectures may completely change with the inclusion of XR technologies. This will not only help improve learning experience but also increase the potential of teaching.
The enterprise application segment includes manufacturing, healthcare, and retail, among others. Manufacturing is expected to be the most impacted end-use application as the extended reality technology has the potential to change common industrial operations into more efficient procedures. Many early adopters have reported an increase in productivity, decrease in delays and increased efficiency in core industrial operations, such as assembly line and maintenance.
Healthcare industry is one of the crucial and essential industries that is not only supporting the economy but also sustenance of human life. Extended reality is likely to affect the industry in various possible applications. Although extended reality is currently being deployed in healthcare training and some operational applications, such as diagnosis, however, with proper integration extended reality can increase overall effectiveness of the industry.
Impact of COVID-19 on Extended Reality Market
Extended reality technologies allow users to indulge more into virtual environment and to interact effectively over virtual or synthetic environments, which does not require any travel or movement. COVID-19 has restricted human movement as the crisis led to a global lockdown. However, with proper access to internet and basic technologies, people have started adopting XR in some form or the other. The mobile and handheld AR applications, especially the social media and gaming applications, saw an increase in daily active user count, which suggest the effectiveness of AR in such mobile applications. The hardware segment of the market also saw some challenges, as it got affected by various trade restrictions imposed due to the lockdown, due to which supply chain was disrupted restricting manufacturing operations. Overall, the Covid-19 helped create a positive outlook toward extended reality, which will put a positive impact on the market.
Competitive Landscape
The competitive landscape for the extended reality market demonstrates an inclination toward companies adopting strategies such as product launch and development and partnerships, collaborations, and joint ventures. Among all the strategies adopted, partnerships and collaborations have been the most prominent strategy adopted by the key players in the market. In September 2020, Facebook announced a partnership with Logitech to develop a physical keyboard in VR. In March 2019, HTC VIVE announced a strategic collaboration with Qualcomm Technologies to pre-integrate and optimize VIVE Wave for Snapdragon standalone XR HMDs and 5G smartphones.
The market players also focused on product development and innovations. In September 2020, Facebook launched the latest version of Oculus headsets the Oculus Rift 2. In February 2020, HTC launched the cosmos series of its VIVE VR headsets.
Regional Market Dynamics
The extended reality market holds a prominent share in various countries of North America, Europe, Asia-Pacific and Japan, and the Middle East and Africa. North America is estimated to generate the highest revenue, in 2020. The large market share of the region has been attributed to the higher adoption of XR technologies in both consumer and enterprise application segments. Europe is estimated to generate the second highest revenue in 2020. This is largely attributed to the market friendliness and positive outlook of consumers toward immersive technologies. Thus, extended reality market is expected to flourish and grow rapidly in the regions of North America and Europe.
Asia-Pacific and Japan, in 2020, is expected to hold a smaller market share as compared to North America and Europe. The market is highly cost sensitive, which has restricted early adoption; however, the market shows a huge potential during the forecast period due to ongoing economic developments. Countries such as Japan and South Korea are already leading the region in product development as well as consumption. Other developing countries, such as India and the ASEAN countries, have a huge potential to become important markets for extended reality.
Focus on AR, VR, MR, Solution (Hardware, Software, Services), Application (Entertainment, Gaming, Education, Manufacturing, Healthcare), Funding, Patents, ROI, and 20+ Countries - Analysis and Forecast, 2020-2025
The extended reality market is estimated at $42.55 billion in 2020 and is projected to grow at a CAGR of 50.9% during the forecast period 2020-2025.
Increasing demand for spatial computing applications, decreasing prices of extended reality hardware, and possibilities of perceived risk reduction through extended reality are some of the drivers promoting the growth of the market.
The technologies covered include augmented reality, virtual reality, mixed reality.
The solutions provided by the extended reality include hardware (AR hardware, VR hardware, MR hardware), software (extended reality development packages, handheld and mobile device apps, content creation software and engines), services (system integration services, content services, others)
The solutions provided by the extended reality include hardware (AR hardware, VR hardware, MR hardware), software (extended reality development packages, handheld and mobile device apps, content creation software and engines), services (system integration services, content services, others)
The global 3D holographic display and services market is projected to grow from $607.6 million...

The global digital twin market is projected to grow from $2.66 billion in 2020 to $29.57...

The global Industrial IoT market generated $72.34 billion in 2018 and is expected to witness a...

The global Augmented Reality and Virtual Reality market has been witnessing a steady growth....